Tutorial
Step 1: Submitting your data
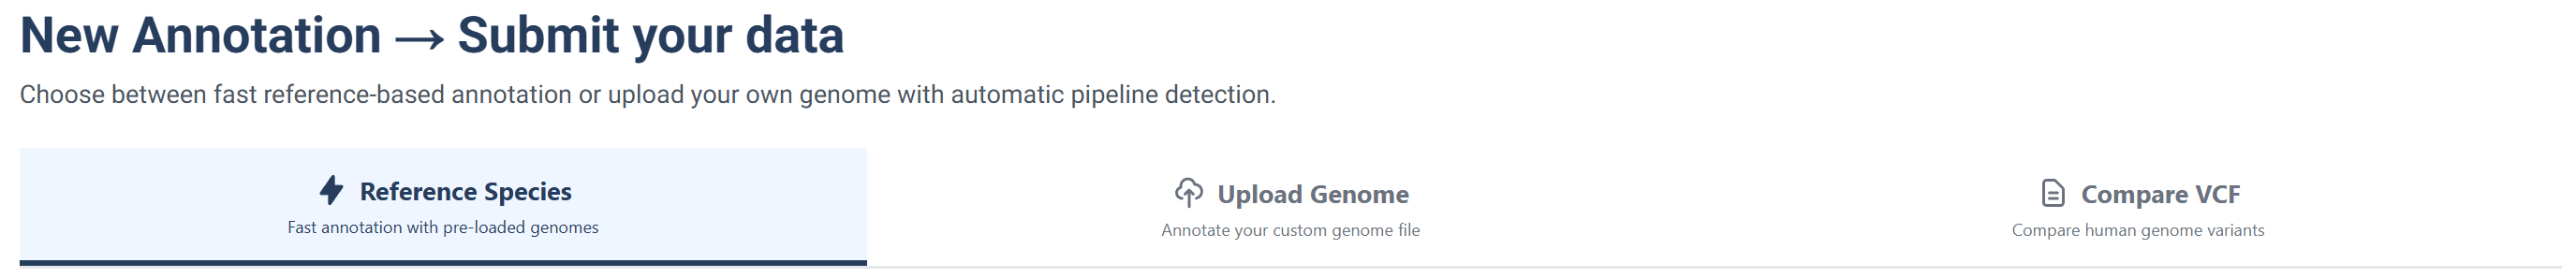
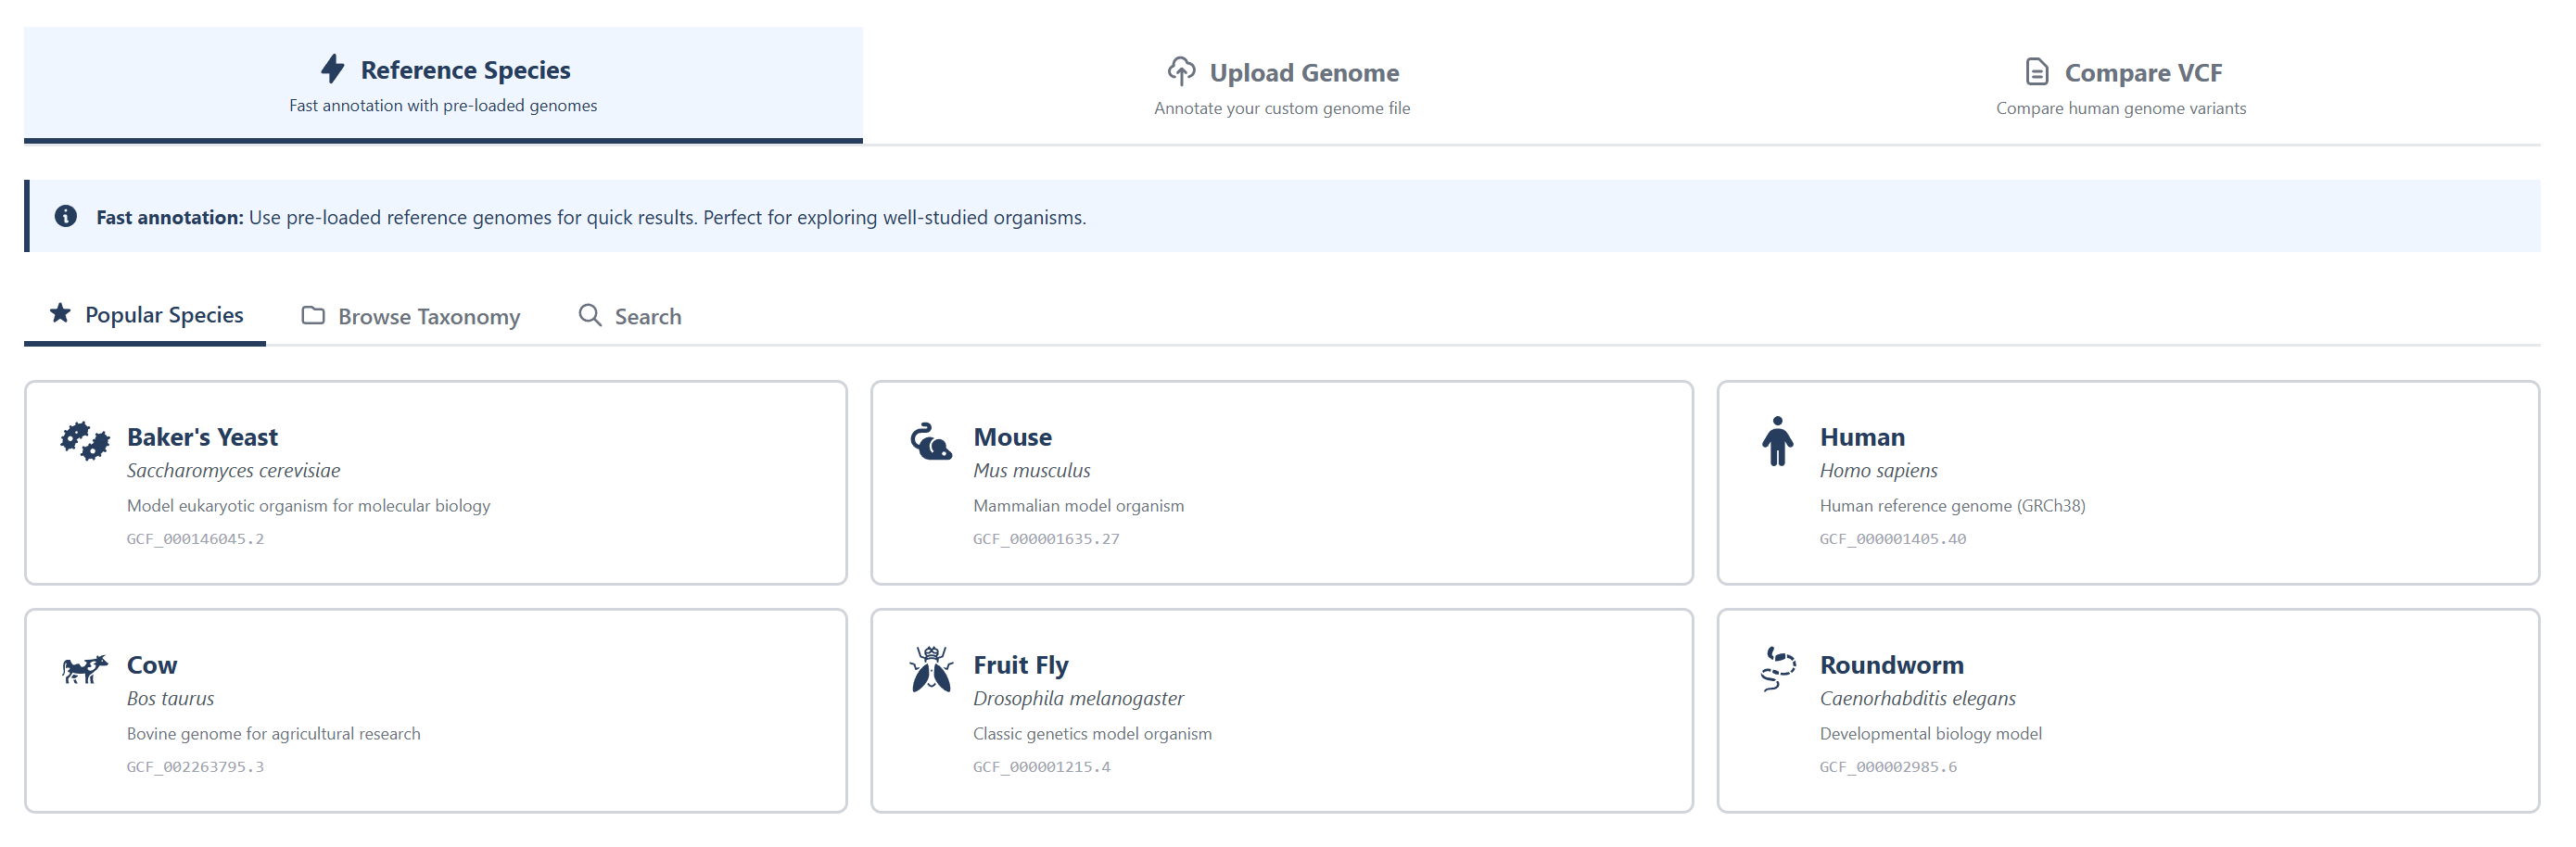
Option 1: Choosing a Reference Species
A) Choose a pre-loaded reference genome for quick results. Examples include Saccharomyces cerevisiae , Mus musculus, Homo sapiens, etc.
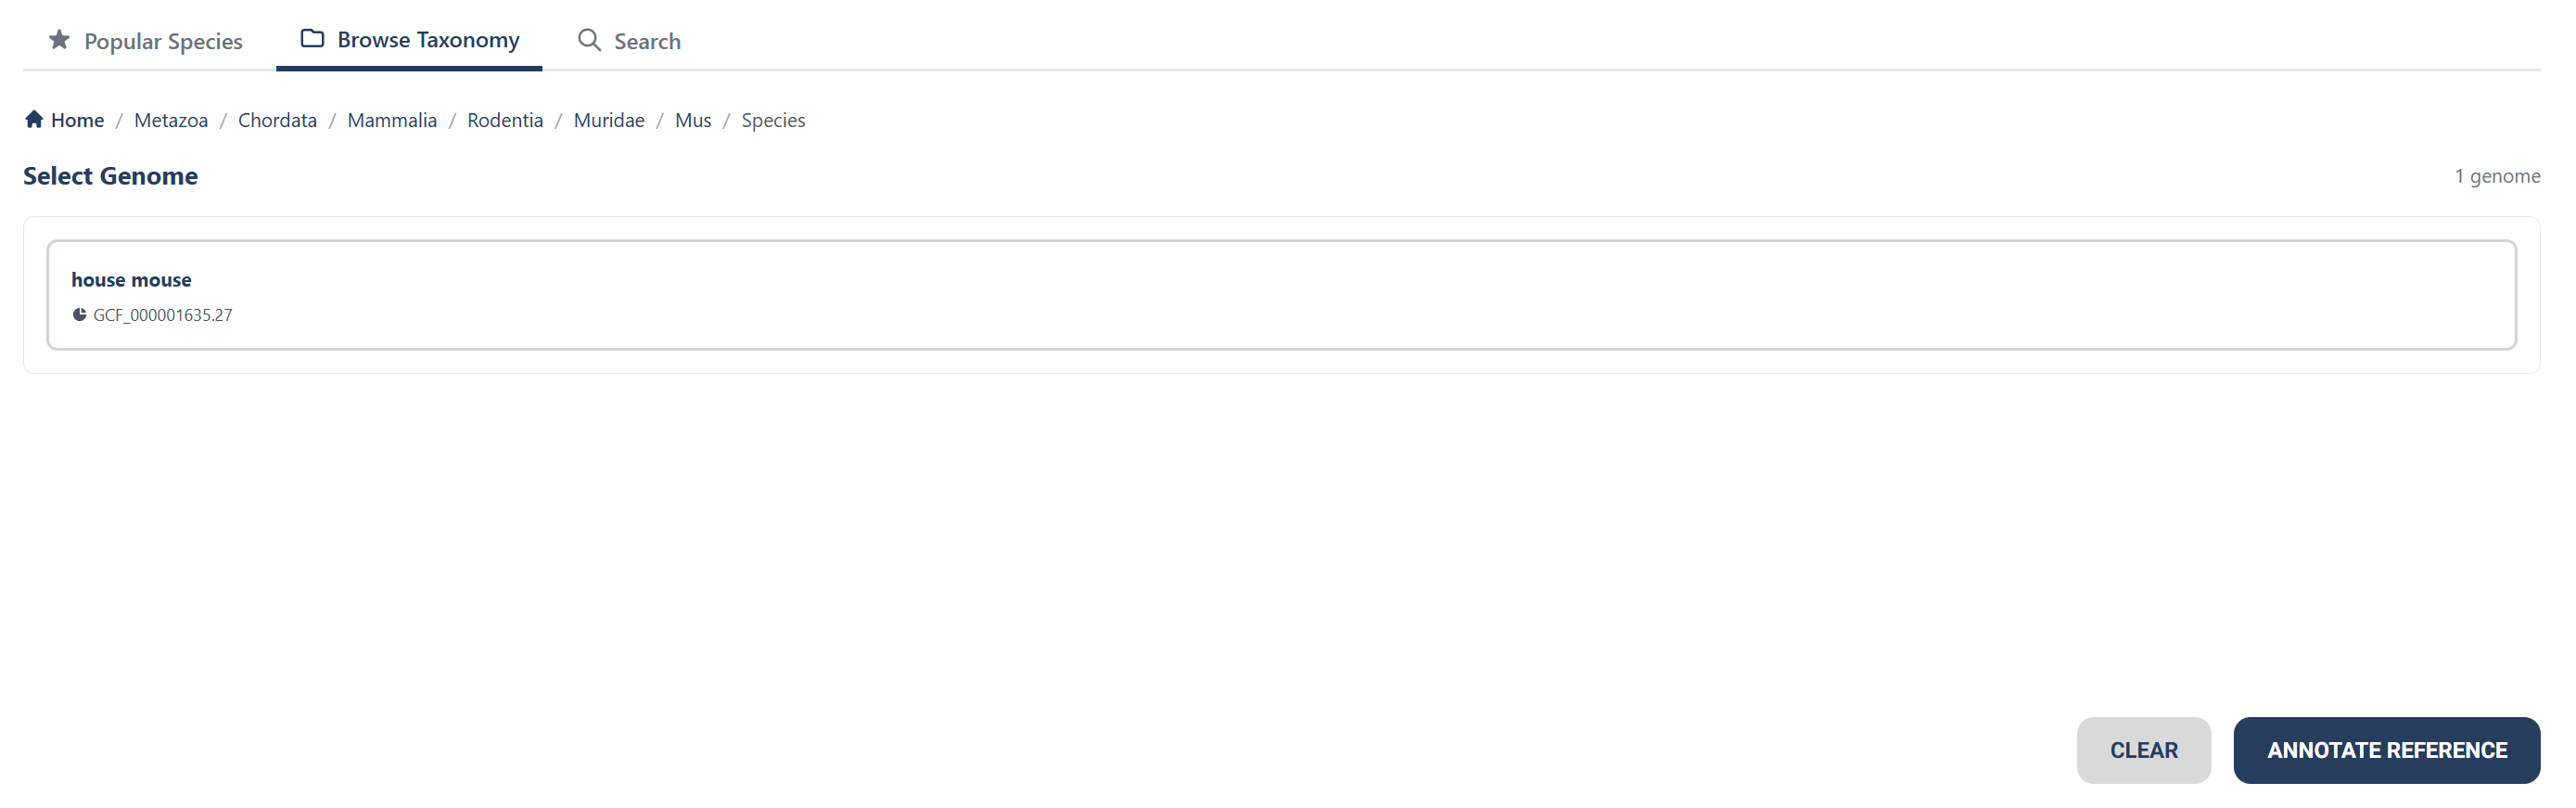
B) You can also use taxonomy search function to find a species you'd like to see the genome of.
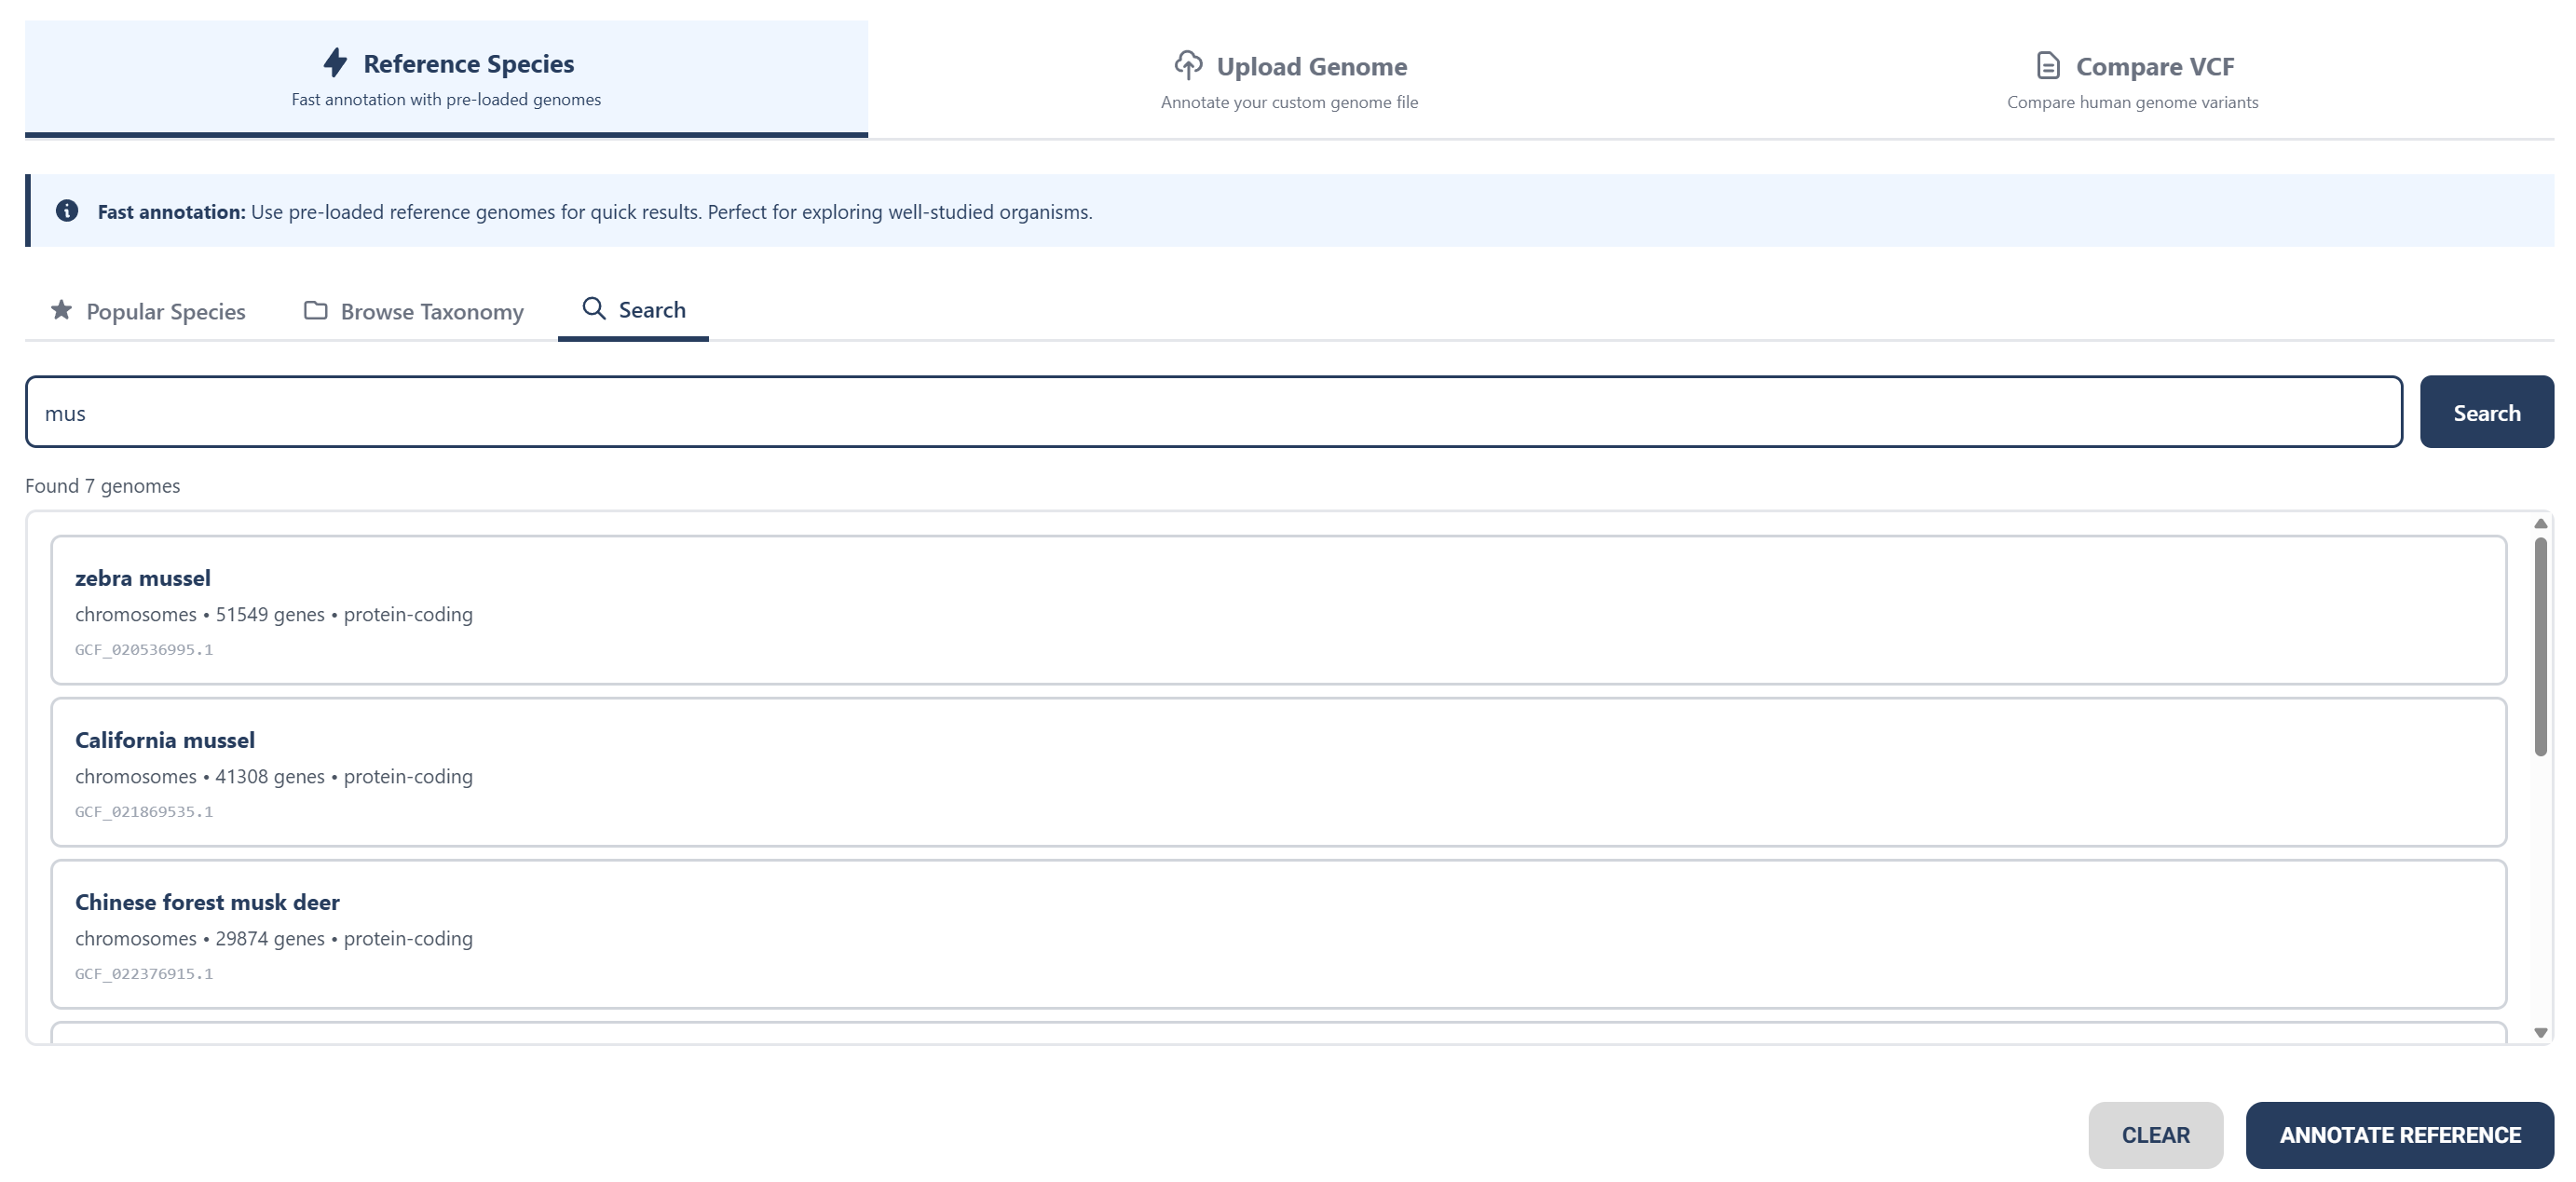
C) If you have a certain species in mind, you can use the search feature to look up that species to see its annotation.
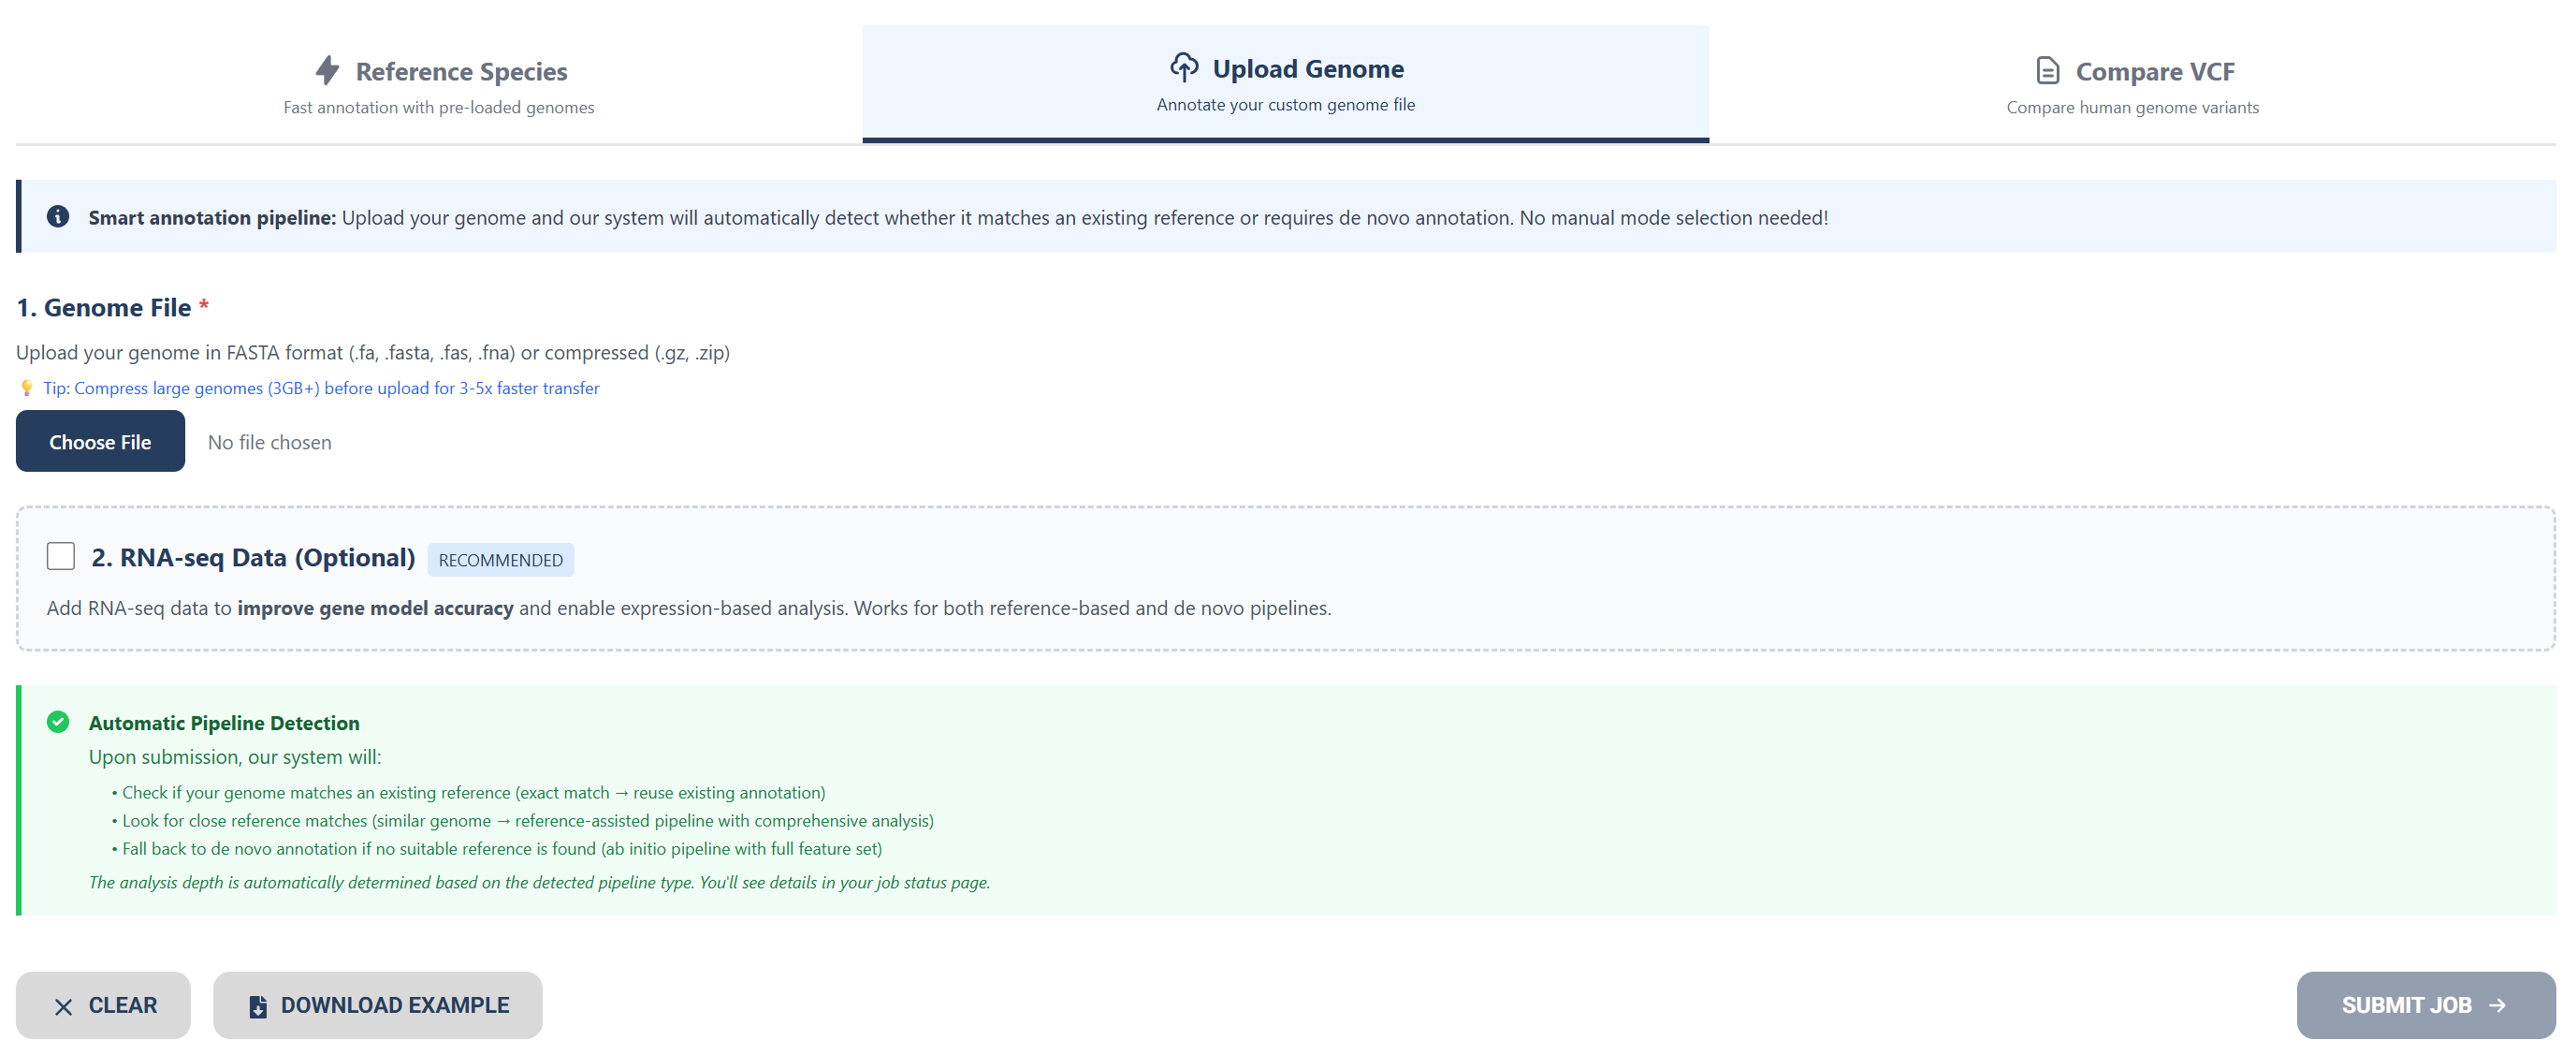
Option 2: Uploading a Genome File
Upload your genome file or raw nucleotide sequence as a FASTA DNA sequence file or compressed file.
Download the examples below to compare filetypes.
Optionally add RNA-seq data to improve gene model accuracy.
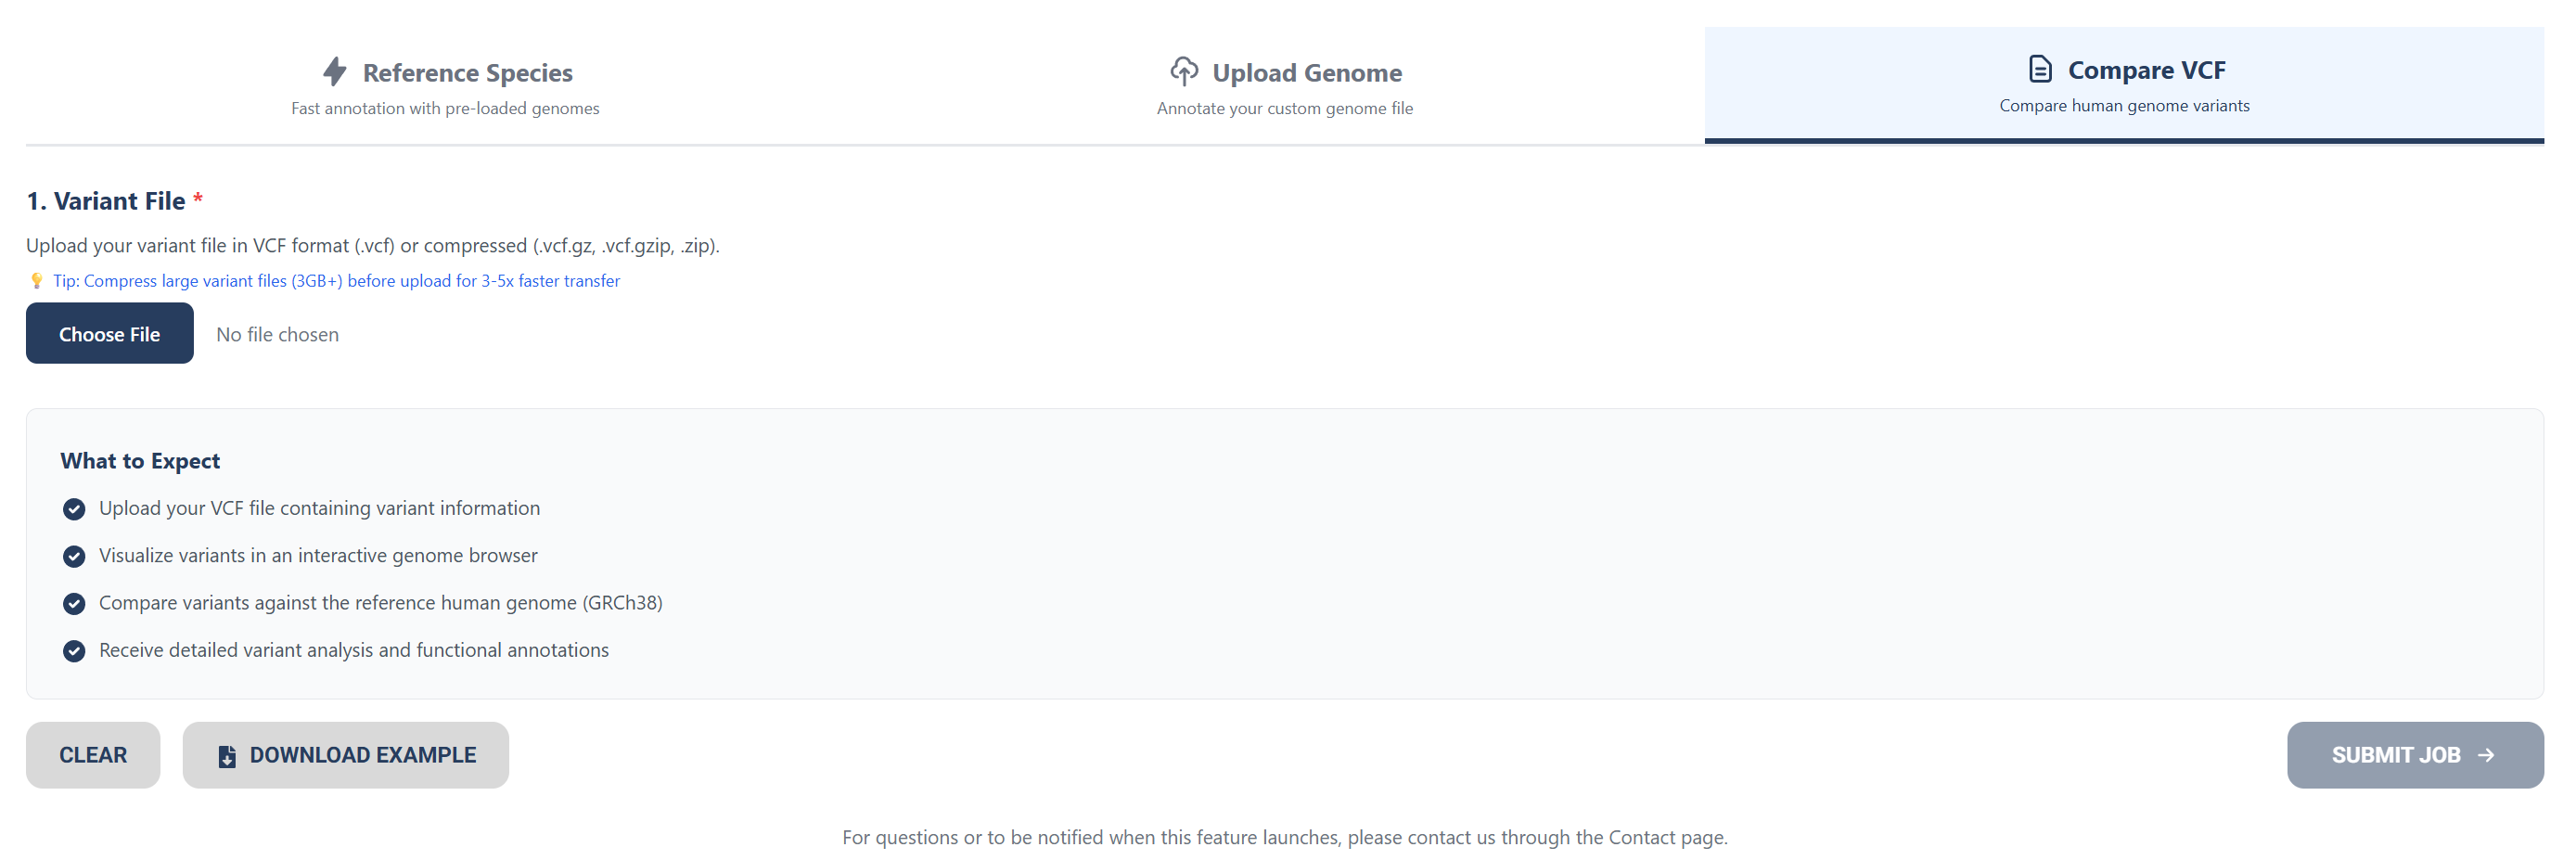
Option 3: Uploading Human Variant Files
To compare human variant files to the human reference genome (GRCh38), upload VCF files or compressed files.
Once your desired input type is selected, press the “SUBMIT JOB” button and wait for your results.
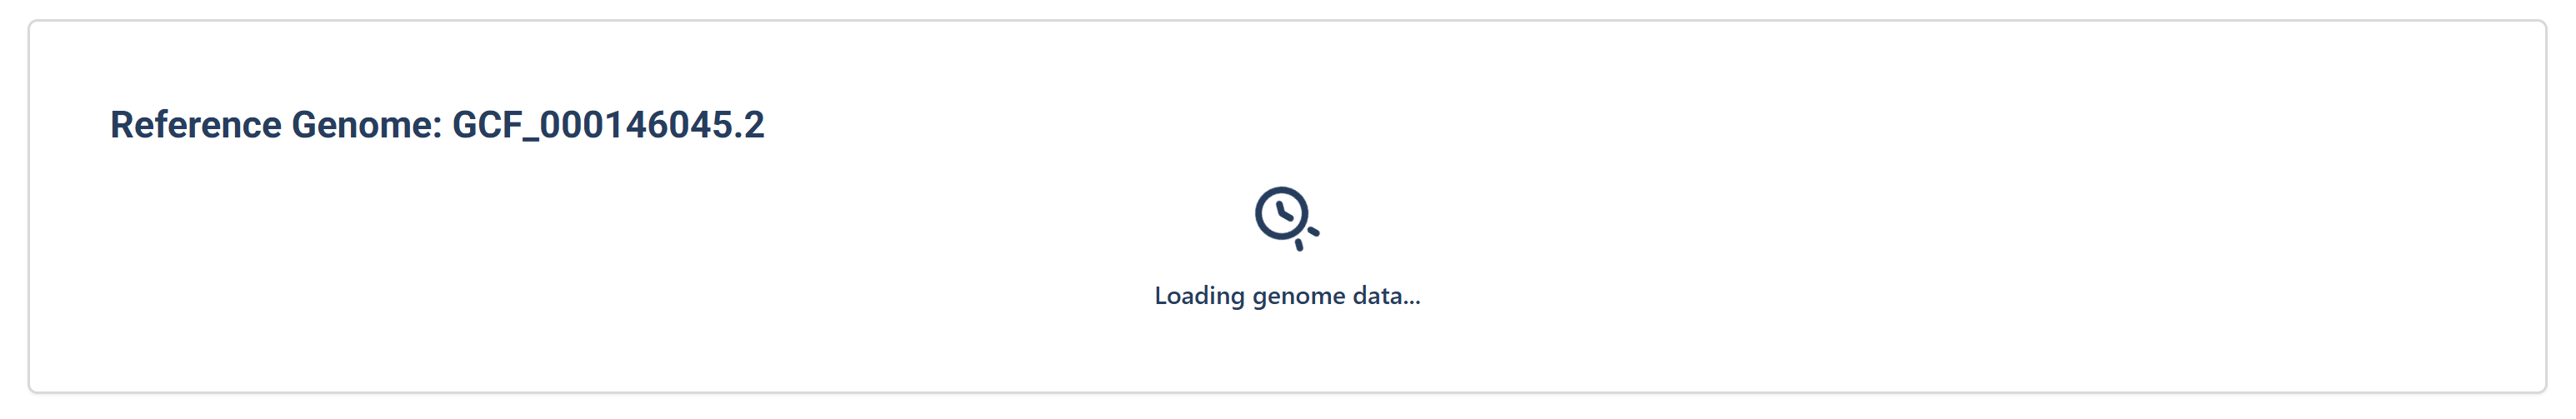
Step 2: Wait for your results
You’ll be directed to a loading screen while your genome data is being processed.
Option A: Submission Processing for a Reference Genome
Submission processing page for choosing a reference genome.
Option B: Submission Processing for an Uploaded Genome
Job annotation submission processing page for uploading your own genome.
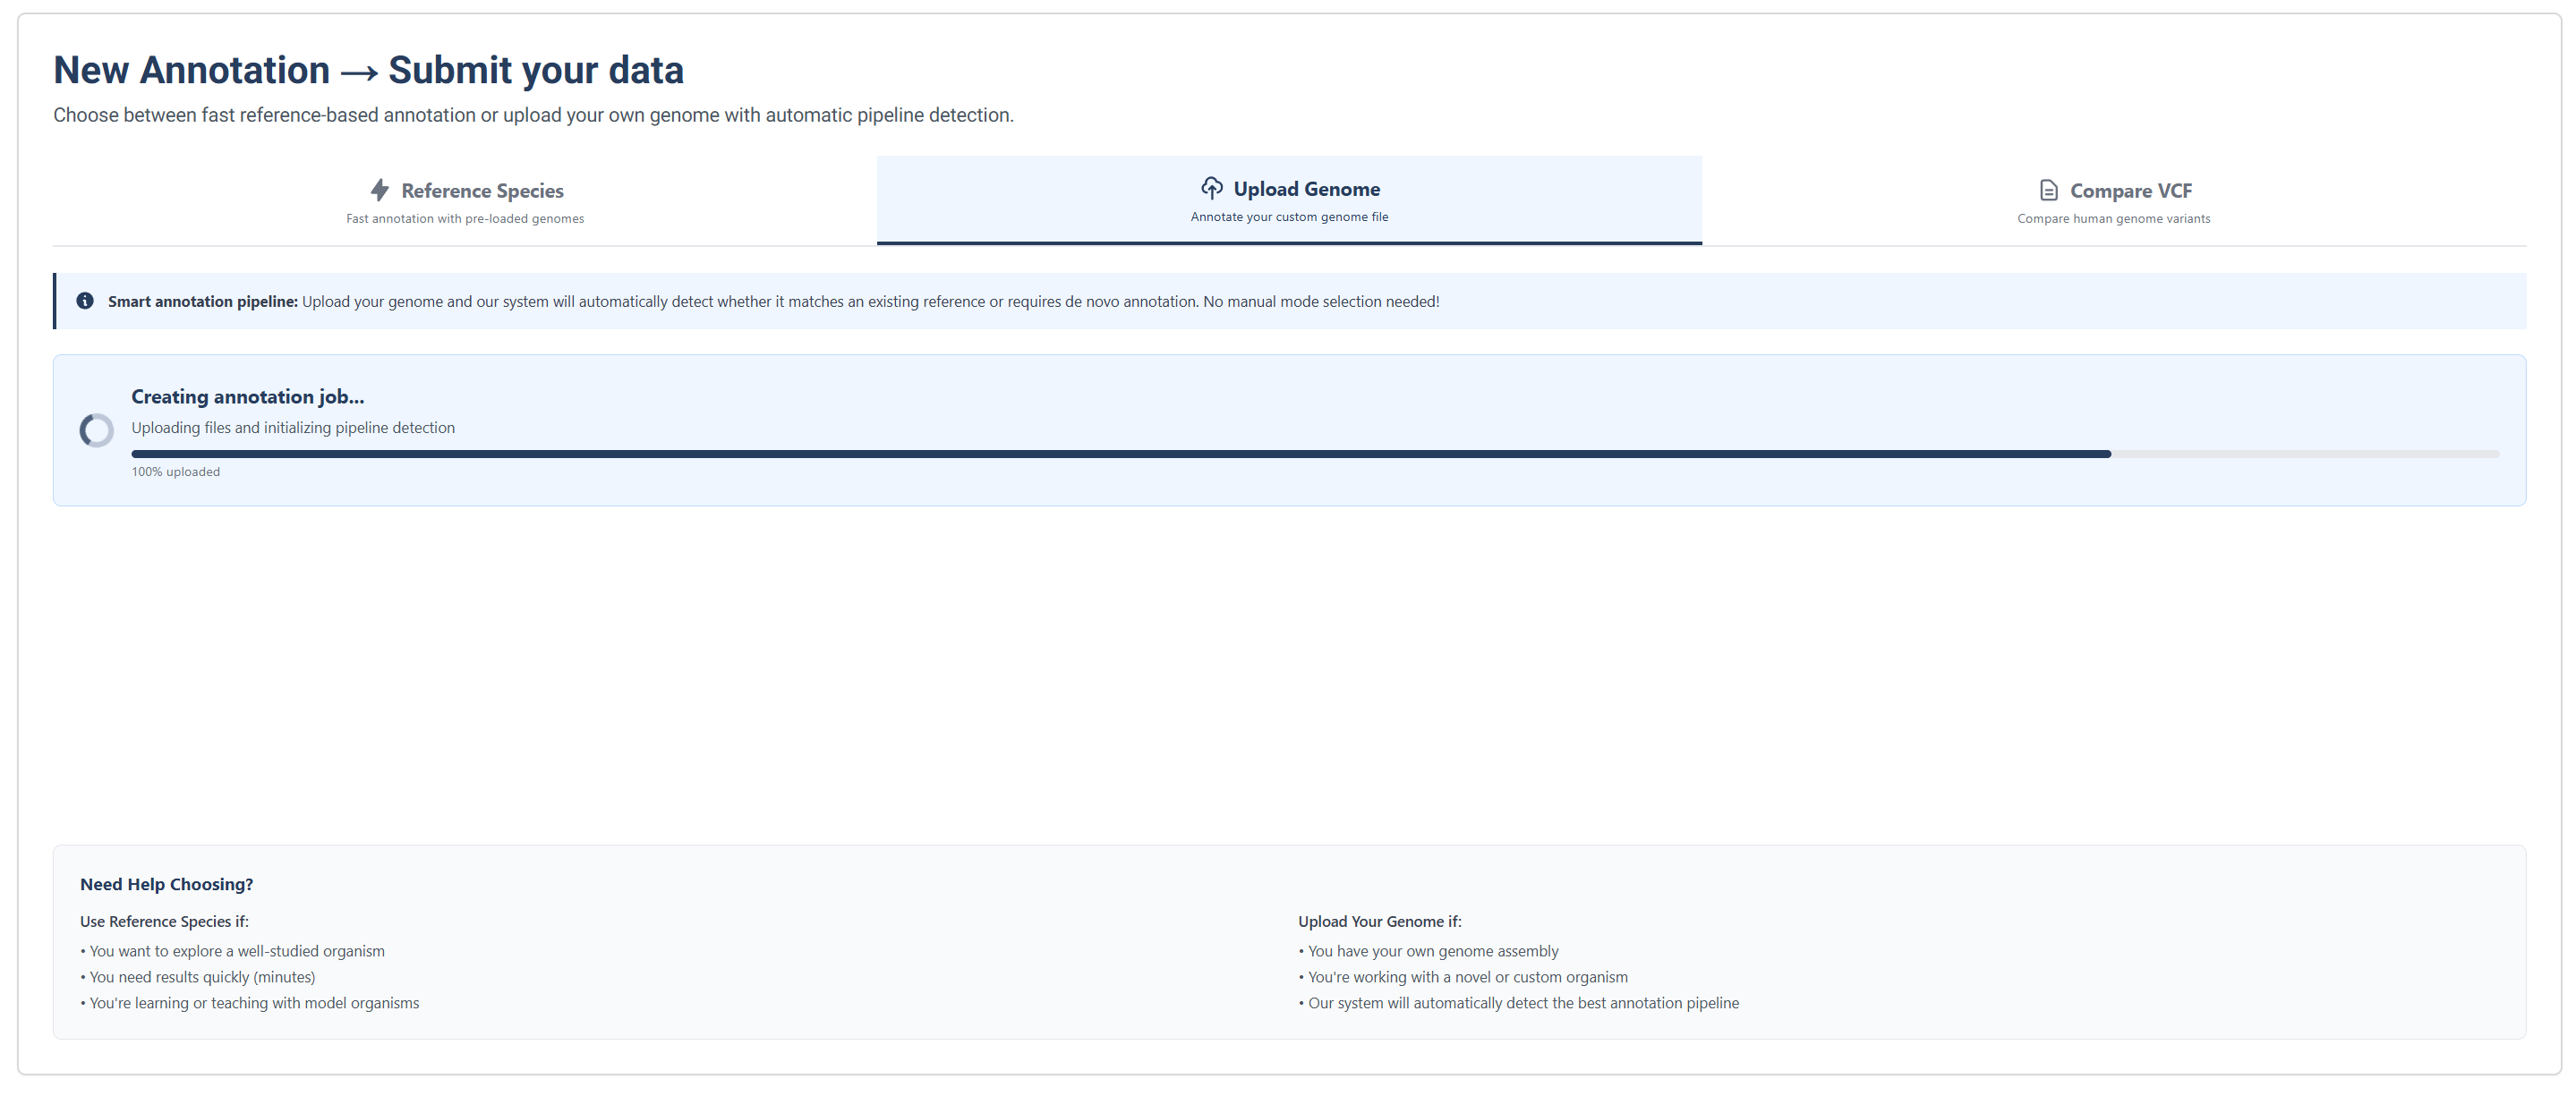
Job submission processing tracker for uploading your own genome.
Step 3: Interact with your genome
Once your data has been processed, explore the annotated genome interactively.
Submission Results

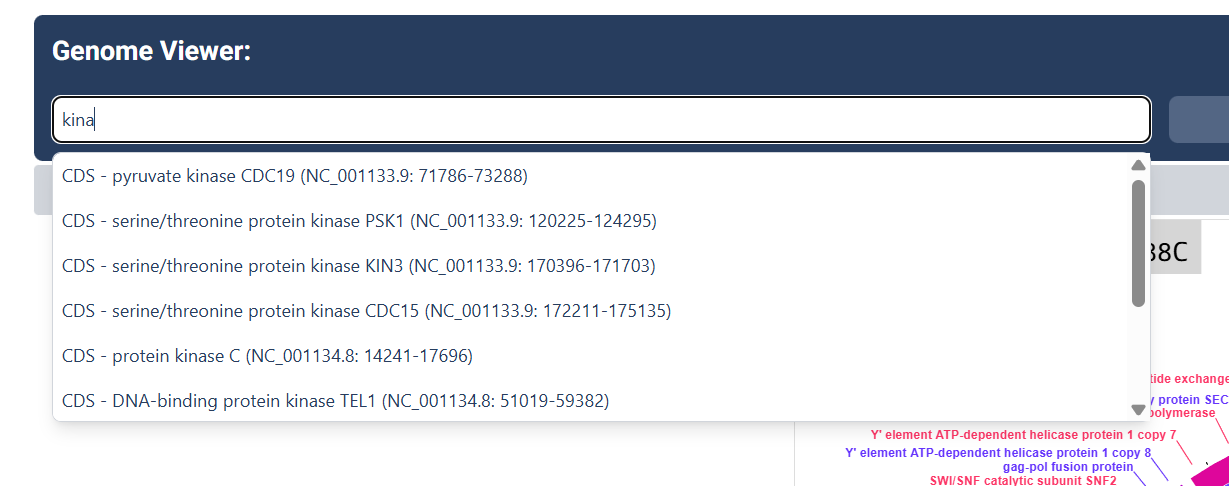
Search for Genes
Use the search bar to search for any specific genes you wish to find.
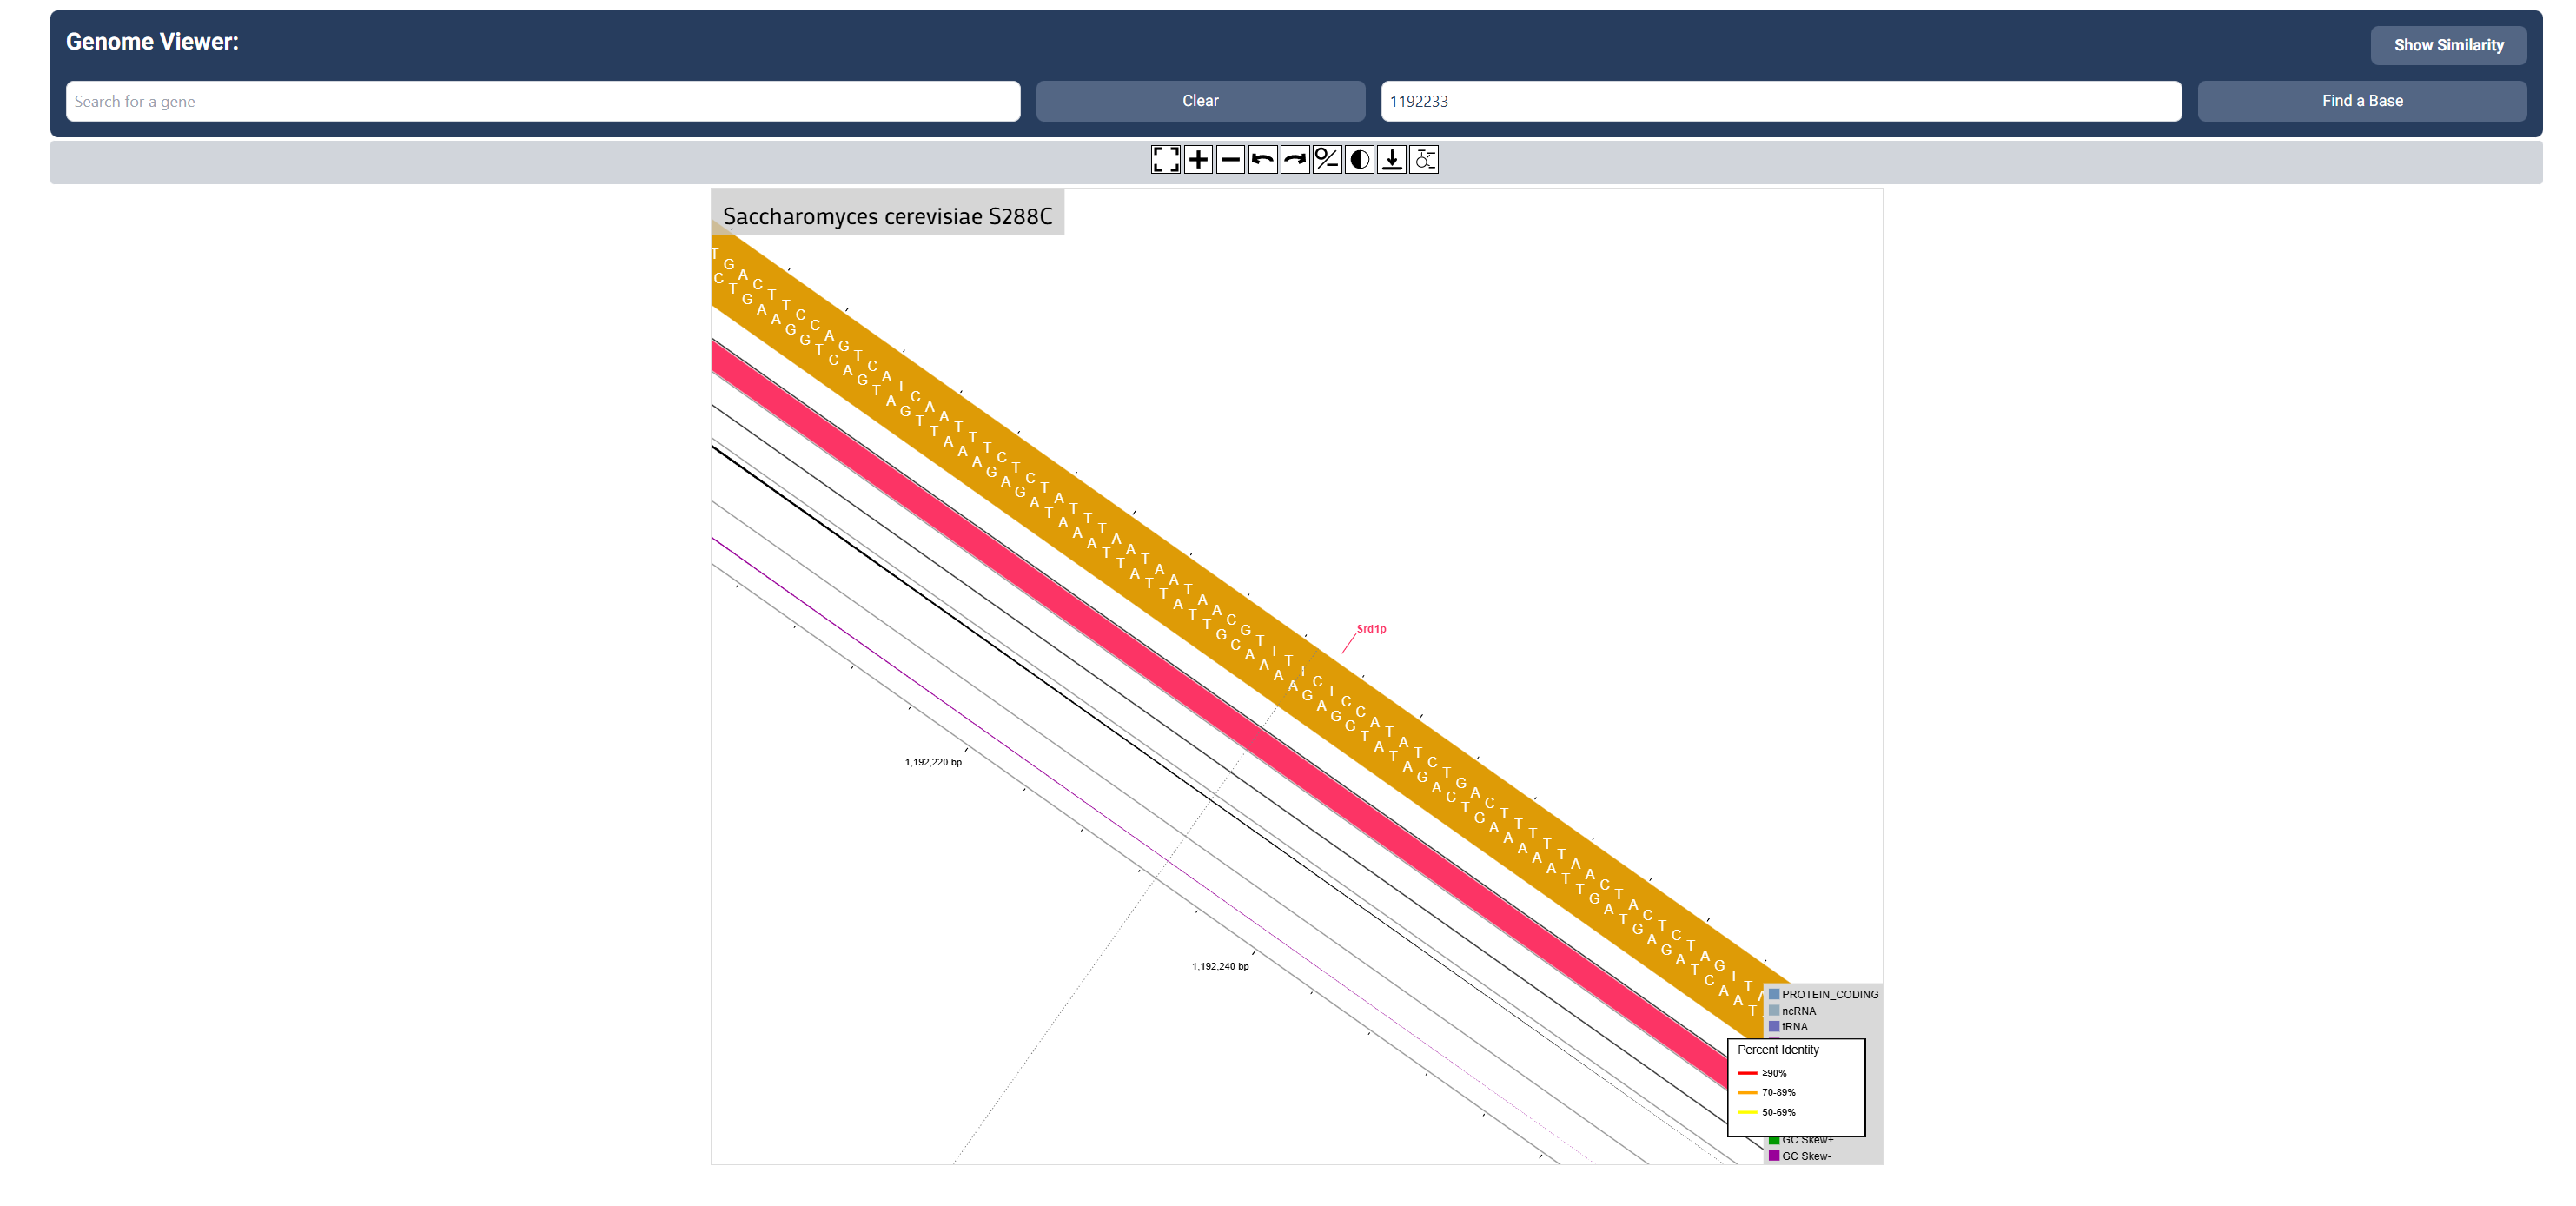
Search for a base
Use the search bar to search for a specific base number you wish to find.
Step 4: Explore certain genes
Click on individual genes to view detailed annotation data.
Basic Information and Function
Selecting a gene directly on the map enables a popup that first shows you the basic information about the gene and its function
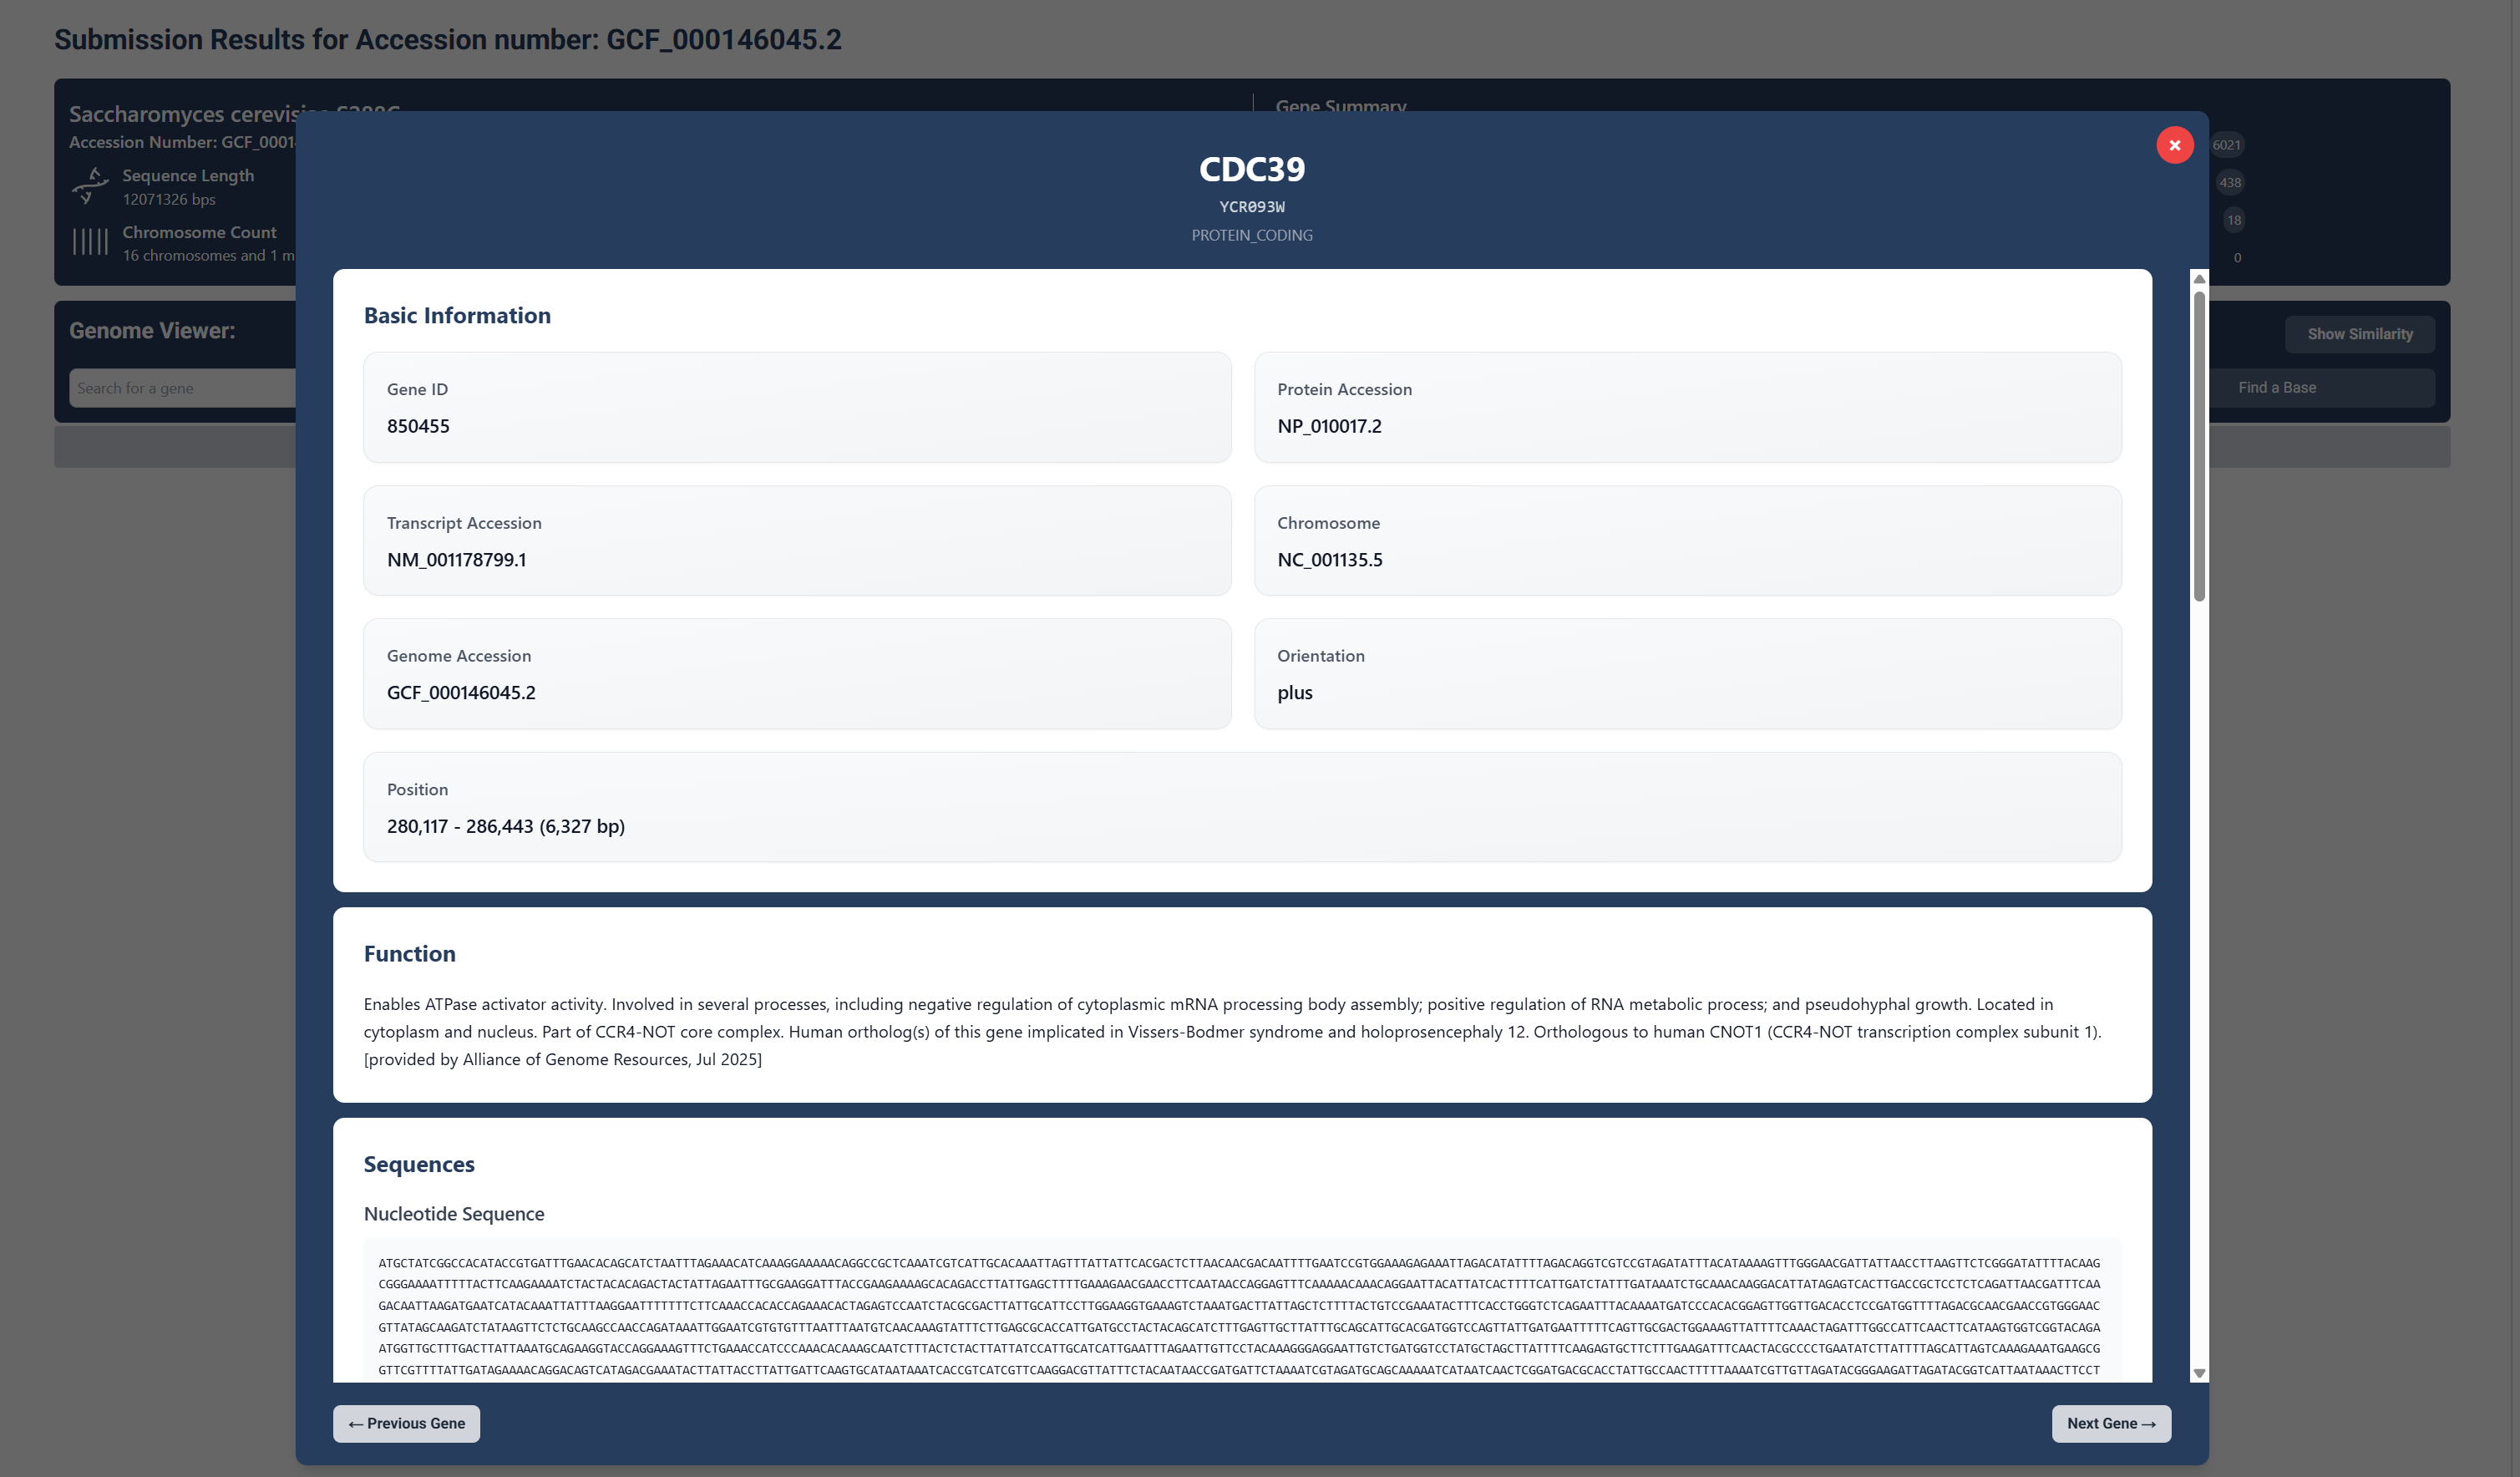
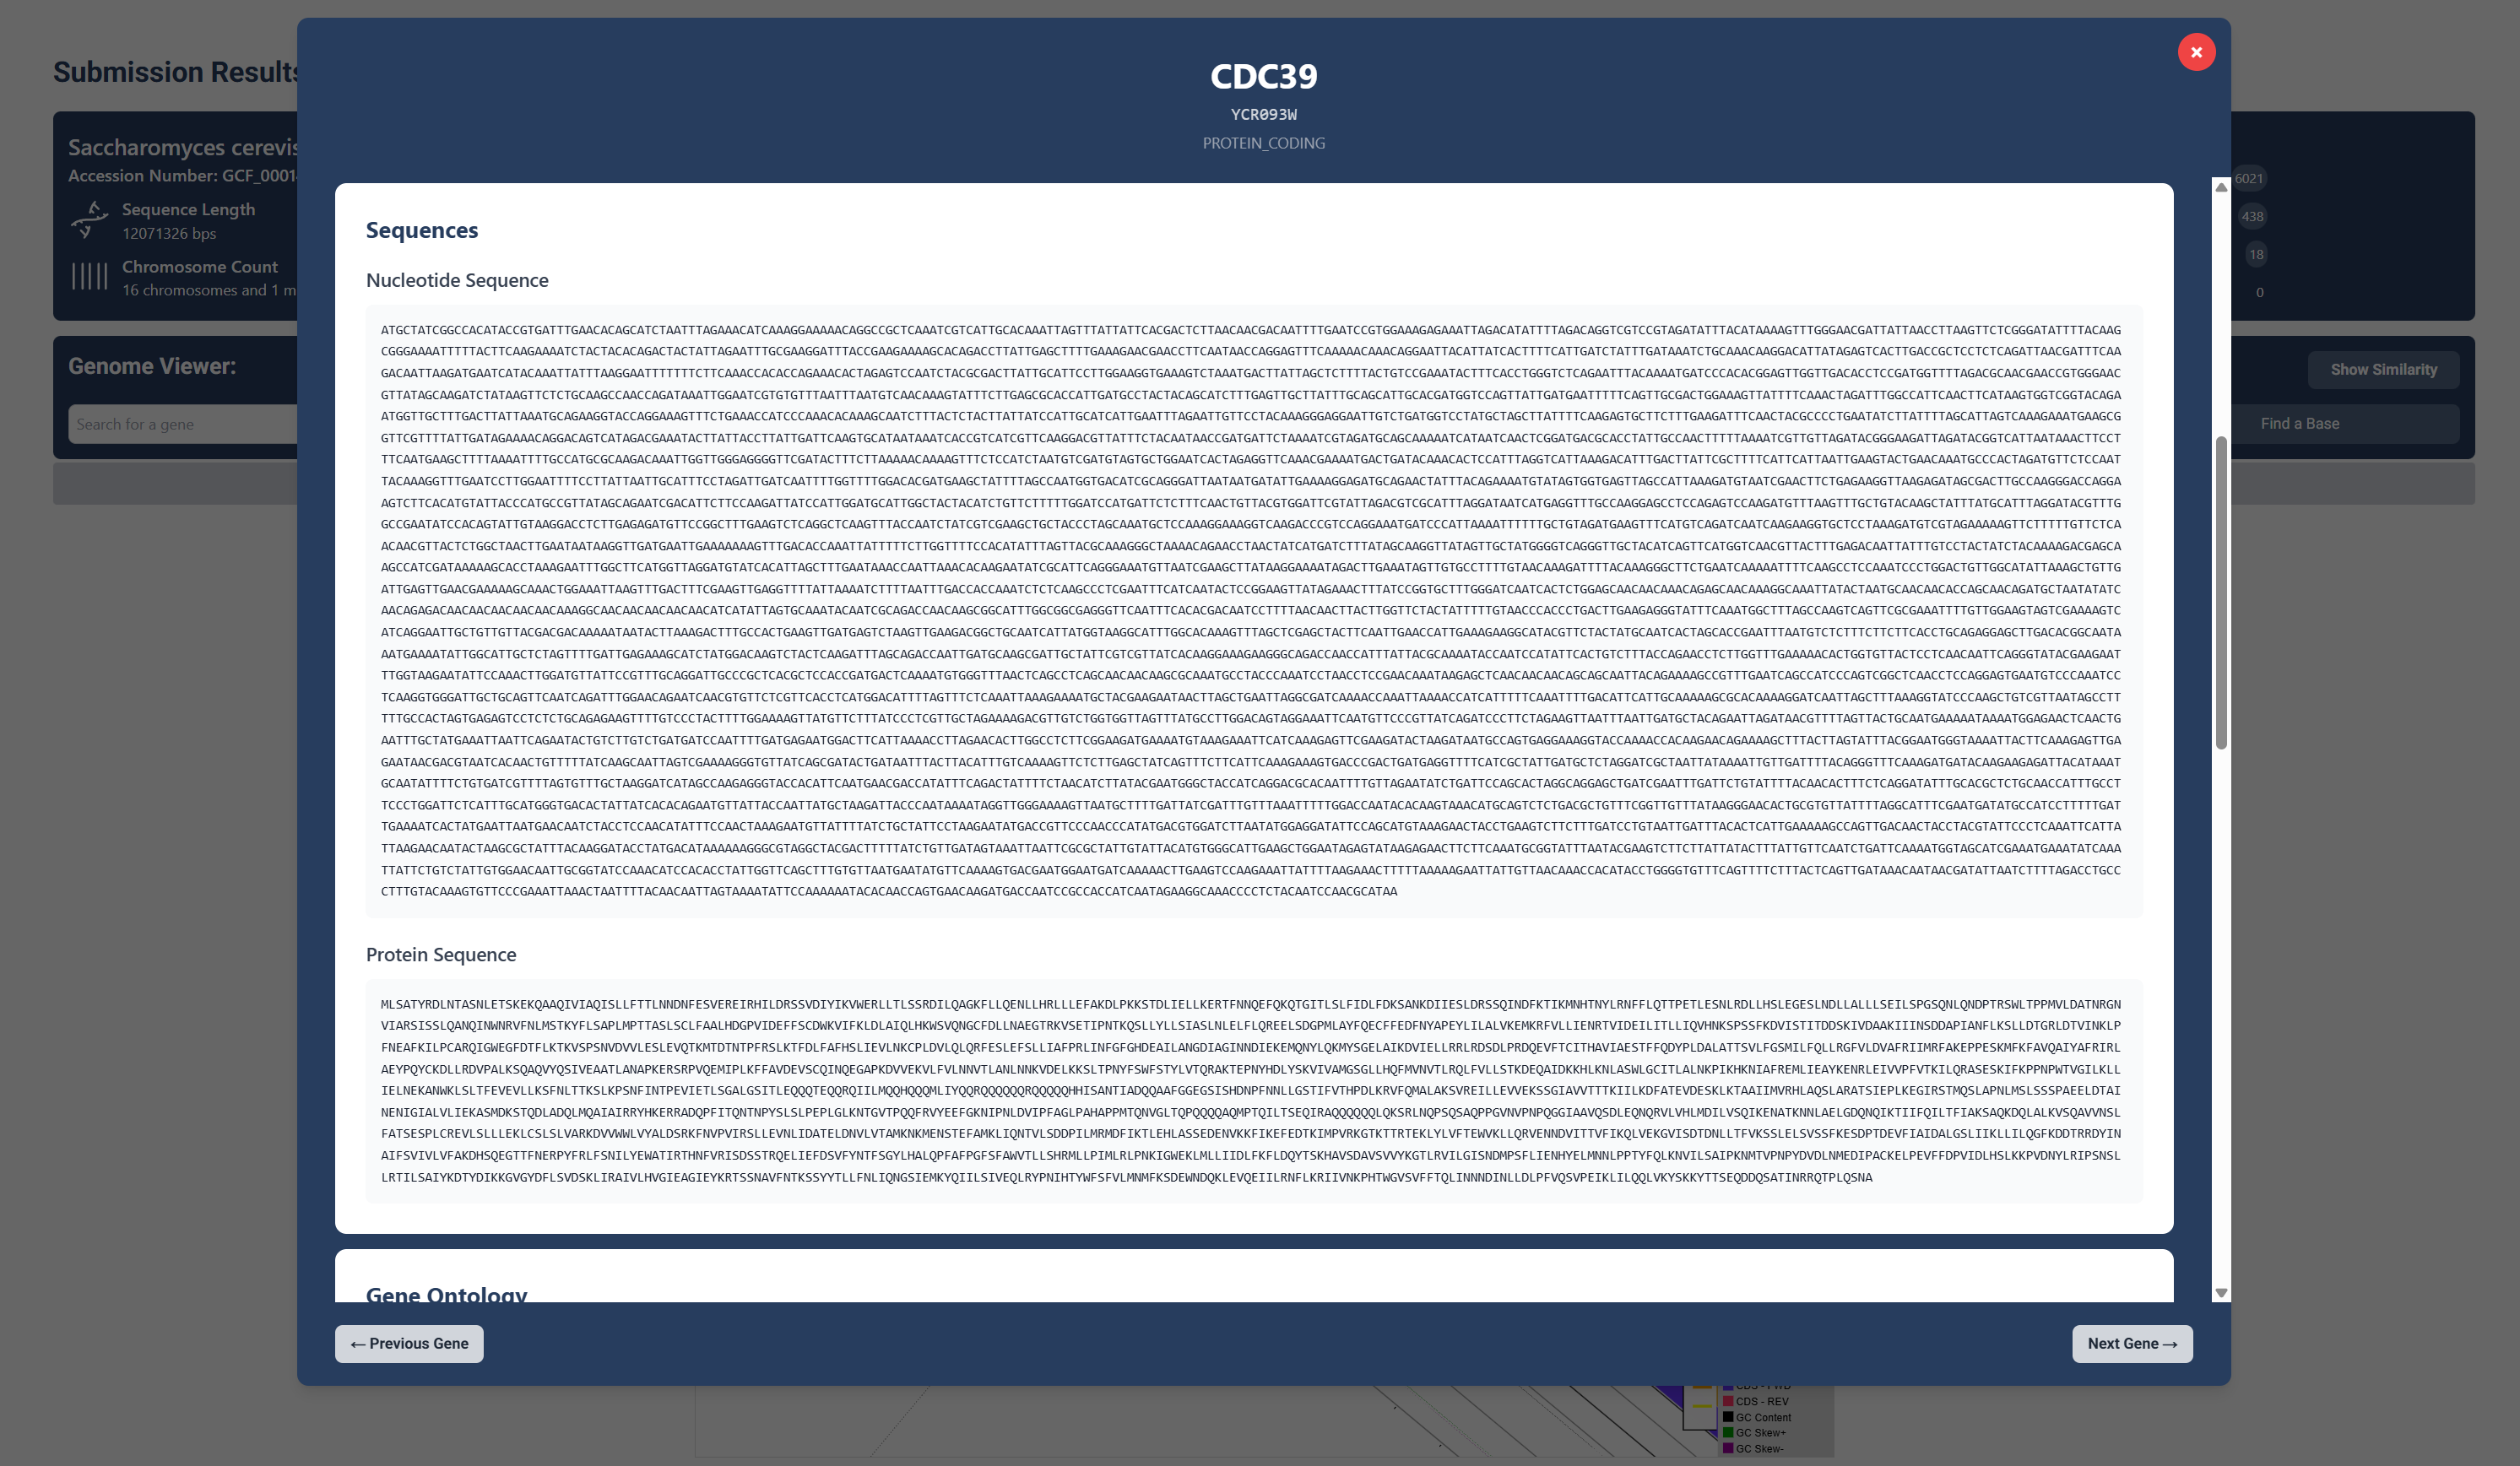
Sequences
Upon scrolling down, you can see the genes nucleotide and protein sequences.
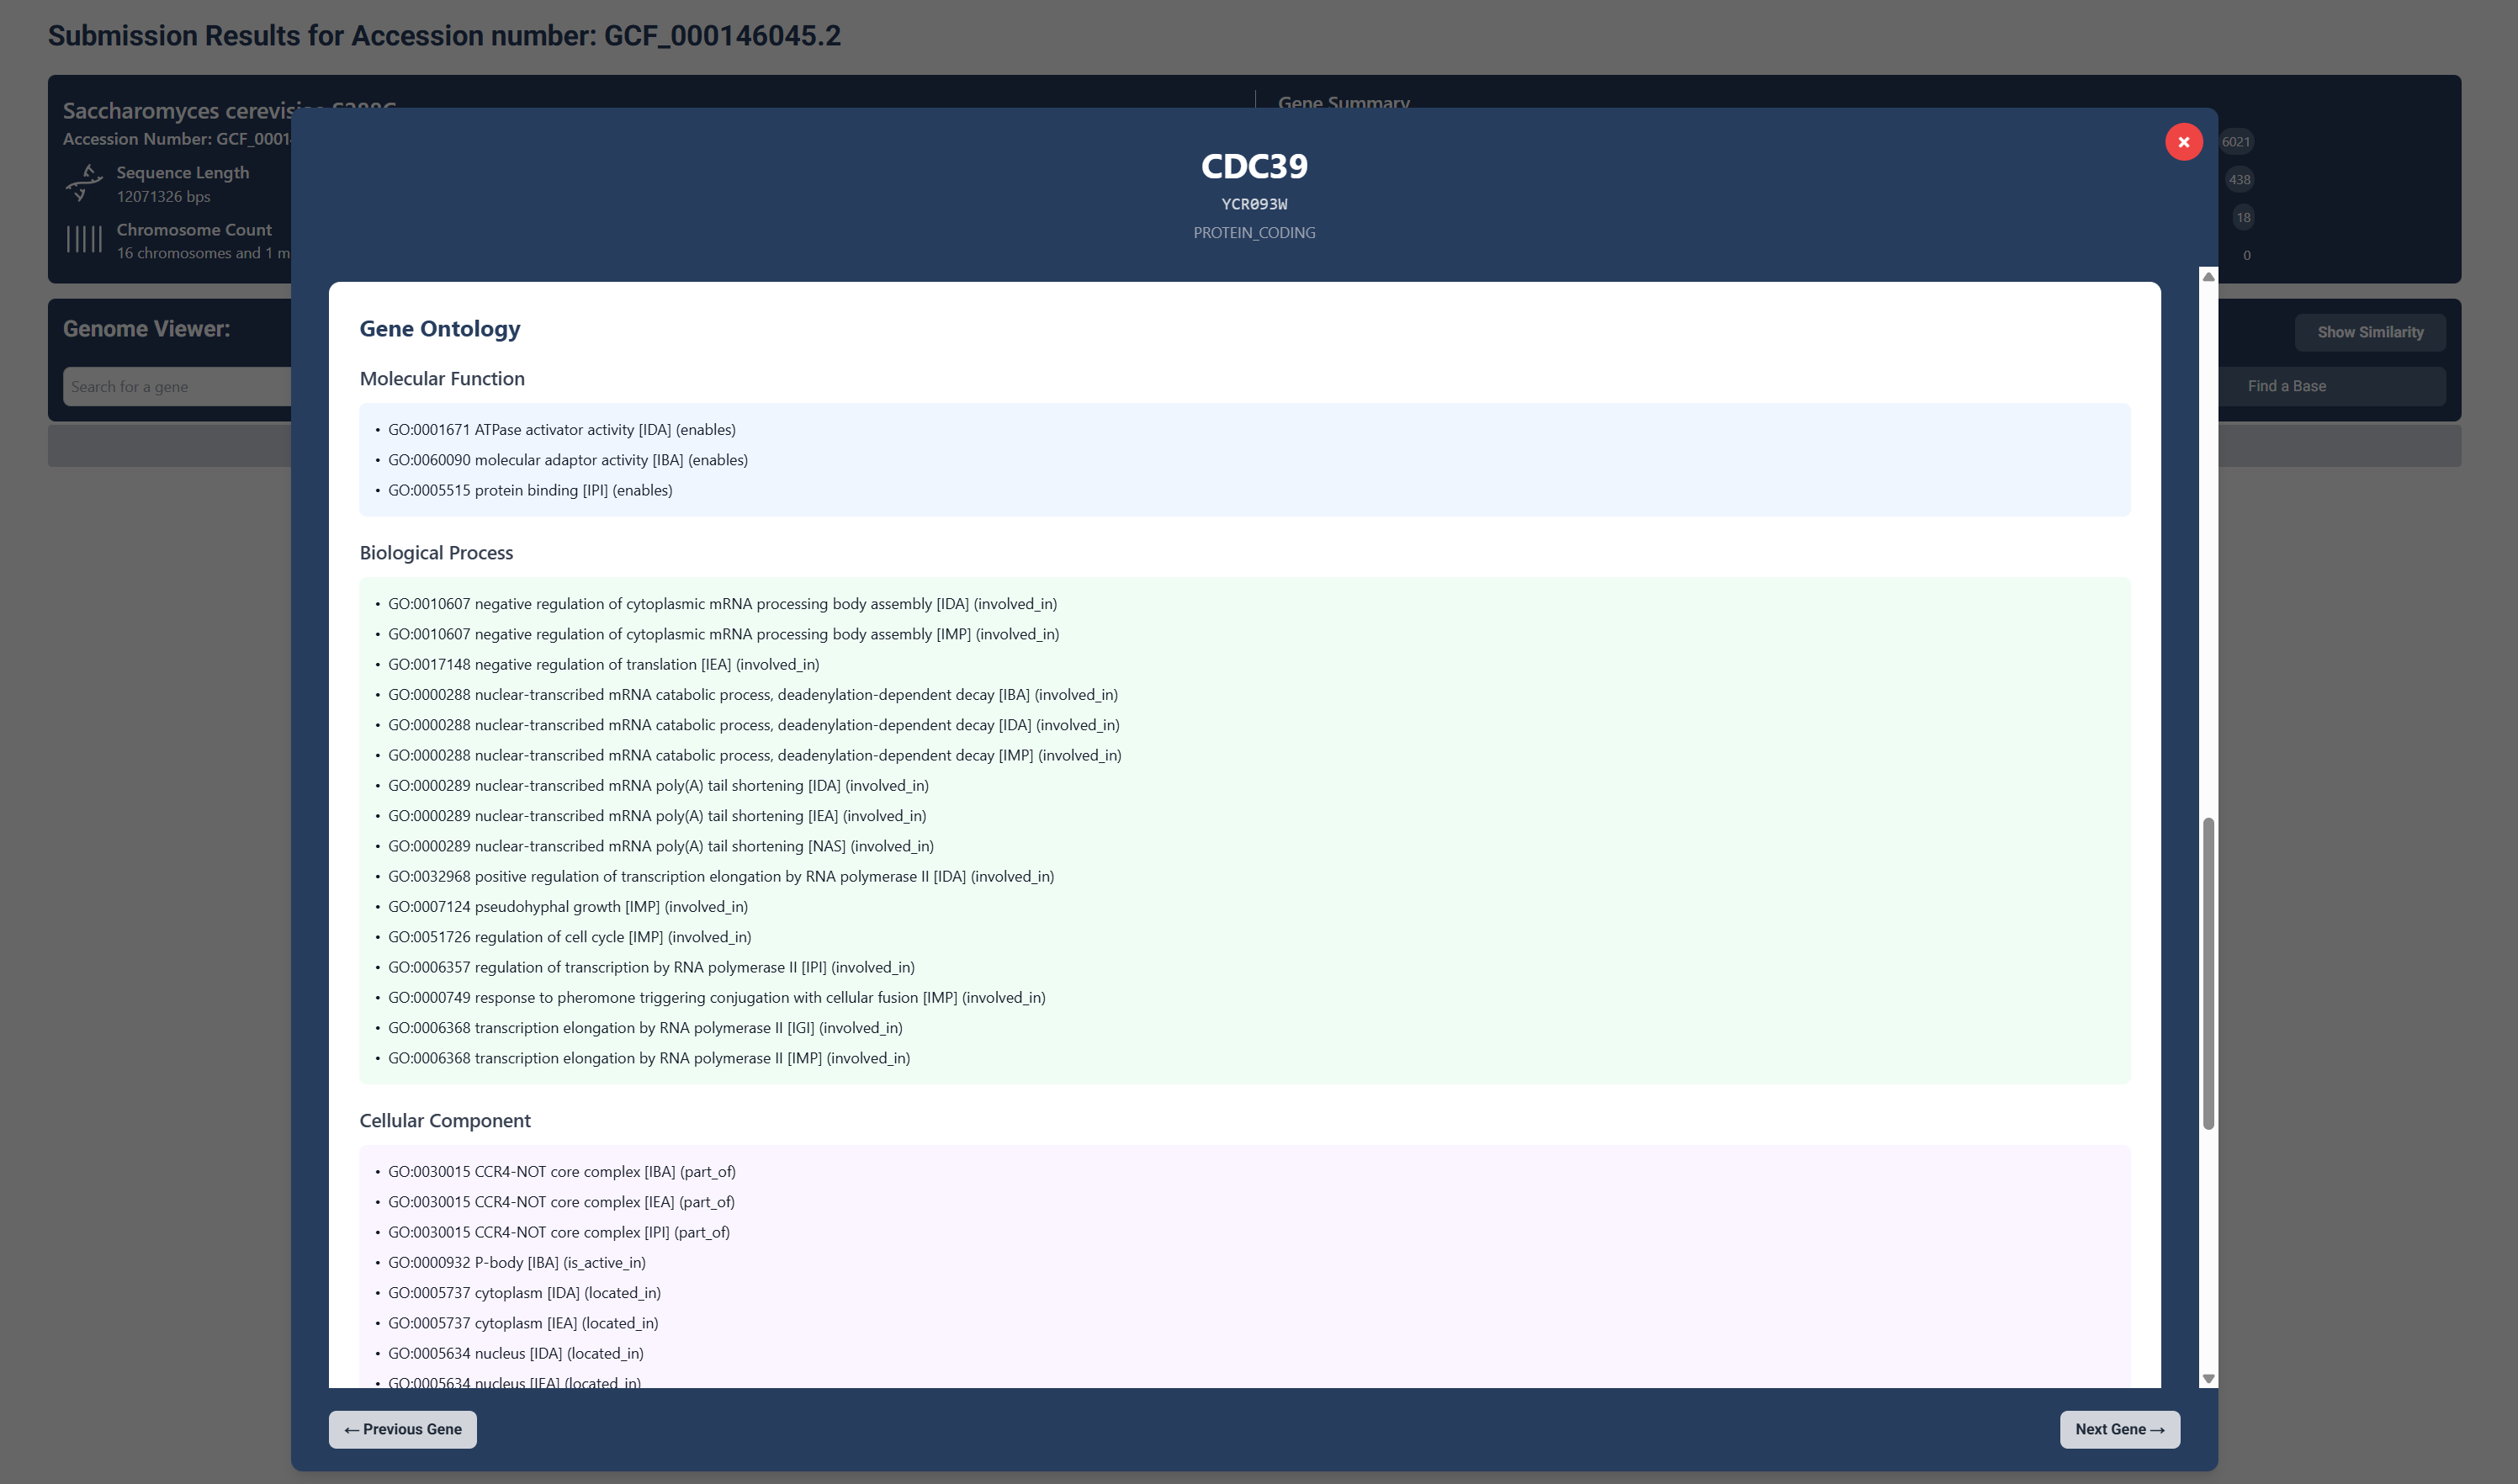
Gene Ontology
Further, you can see the genes molecular function, biological processes and cellular components.
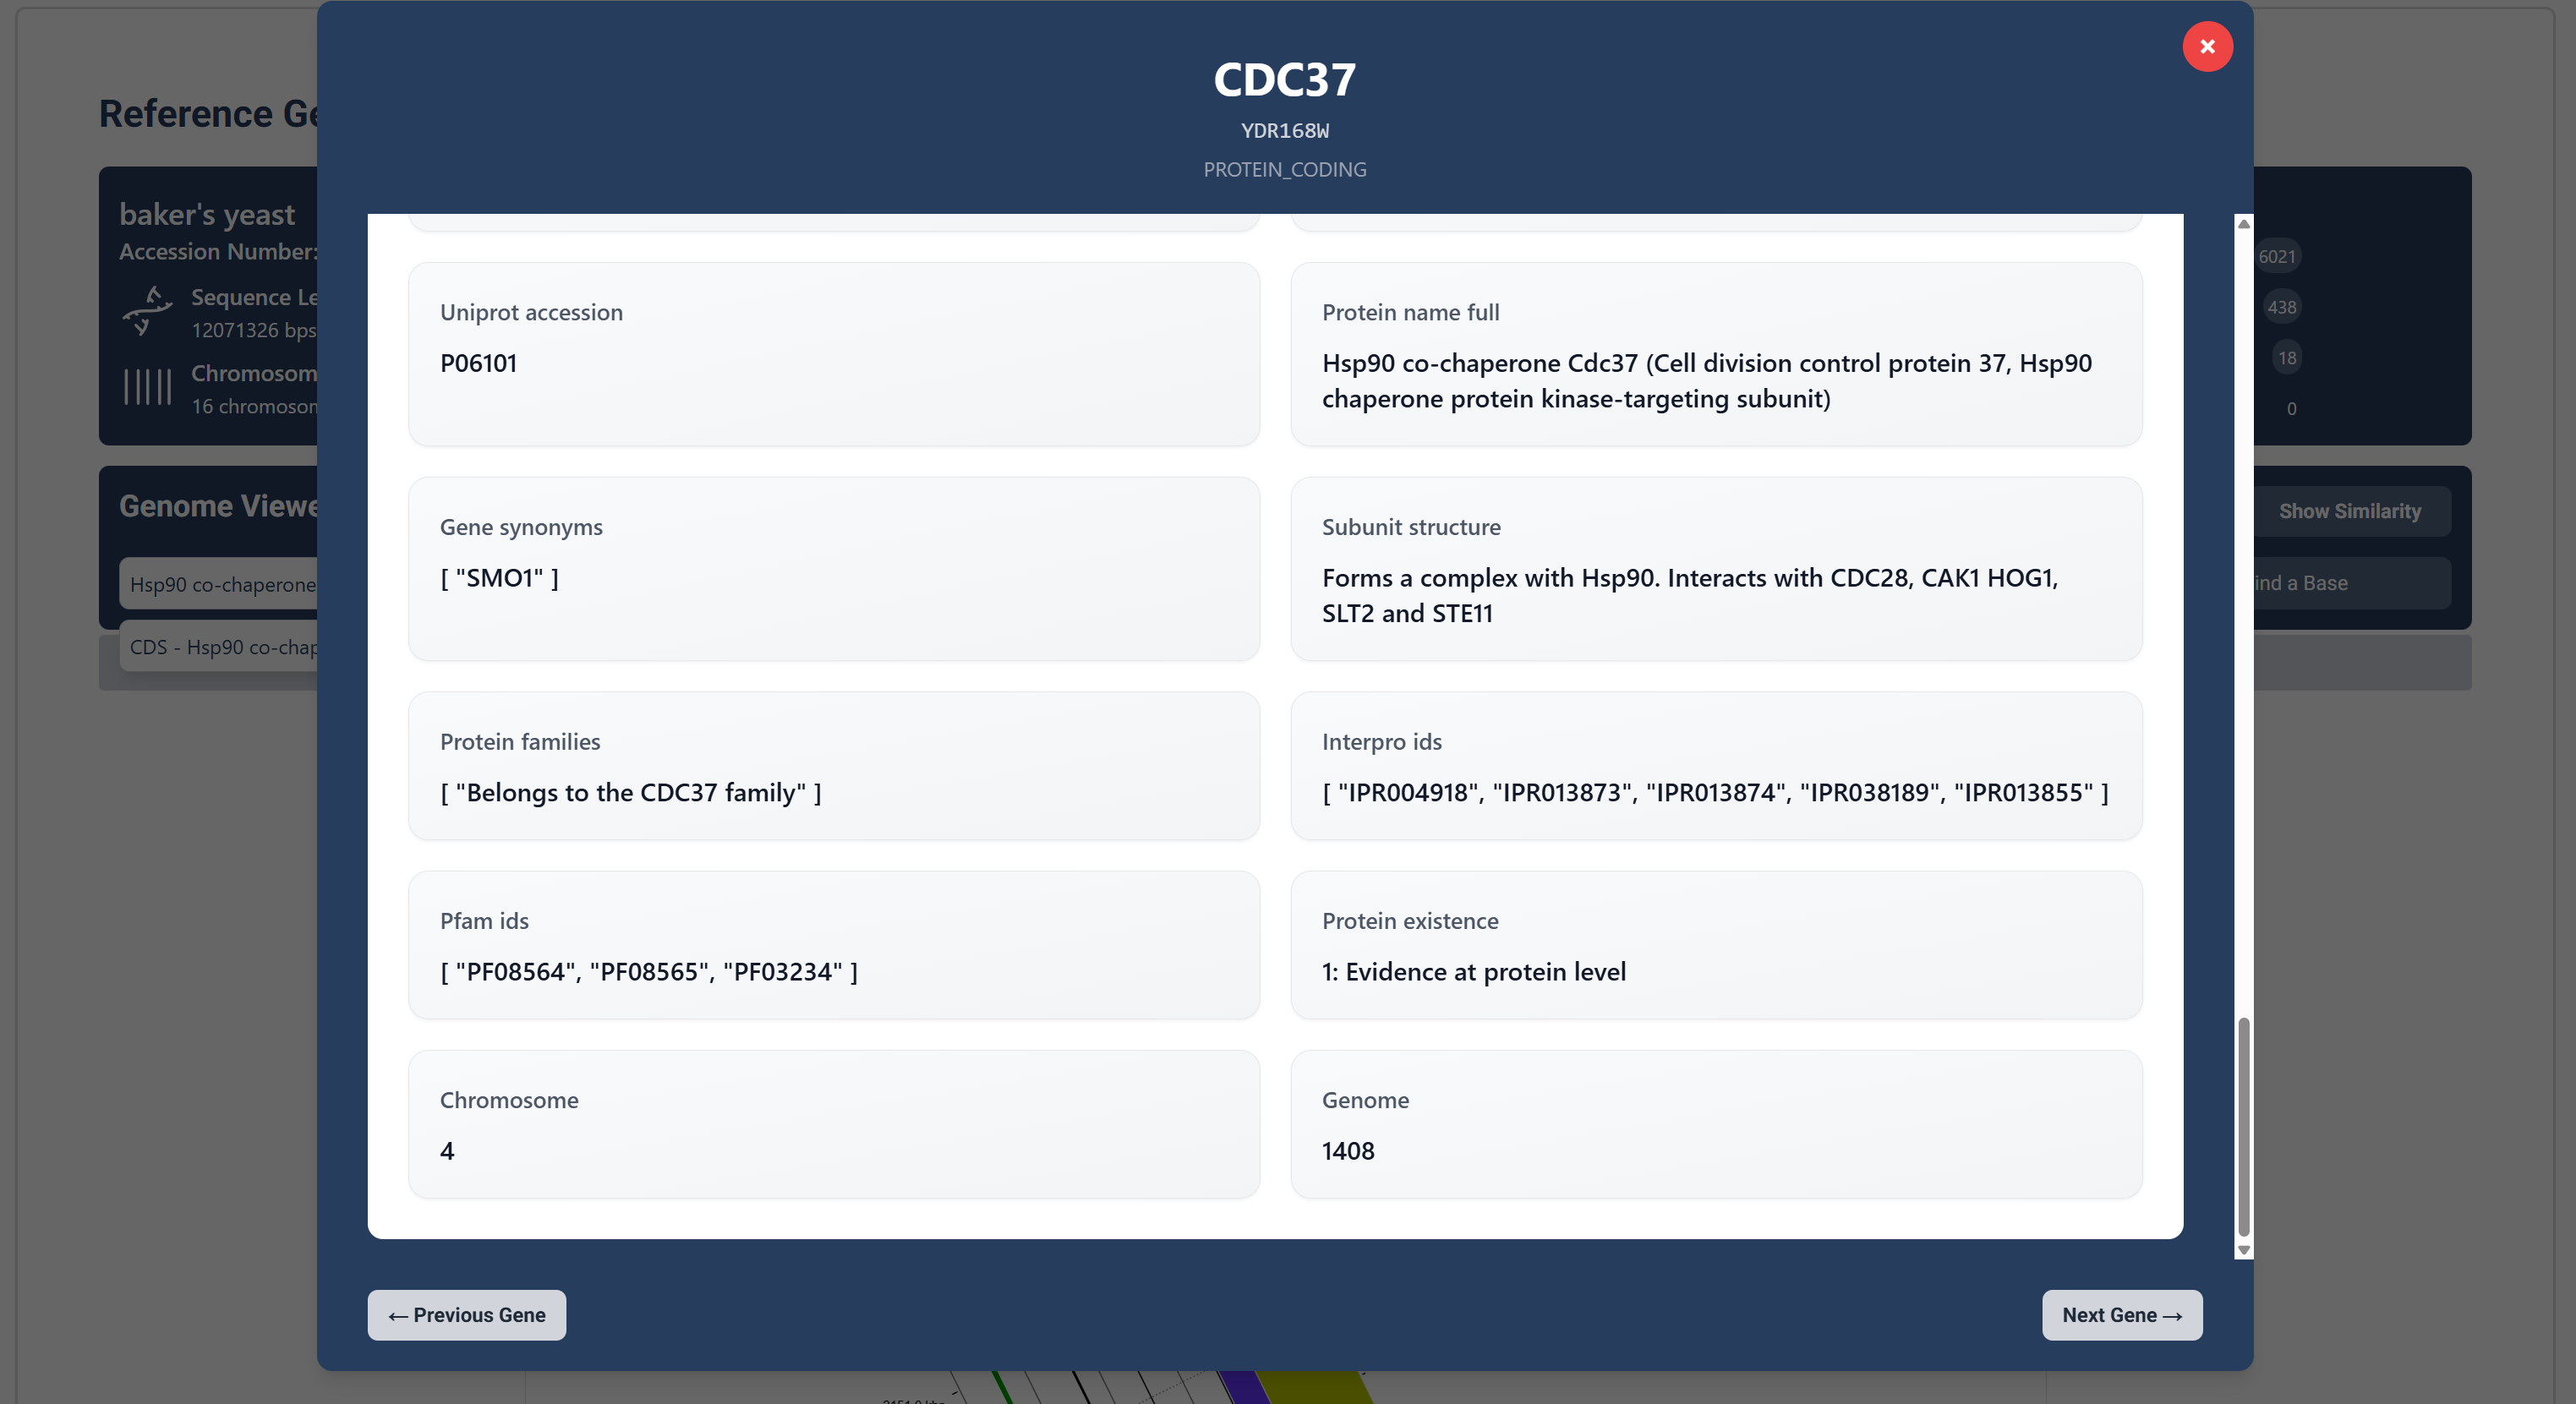
Additional Information
Lastly we have provided additional information that can be found about the gene, including molecular weight, UV absorbance and various amino acid contents.
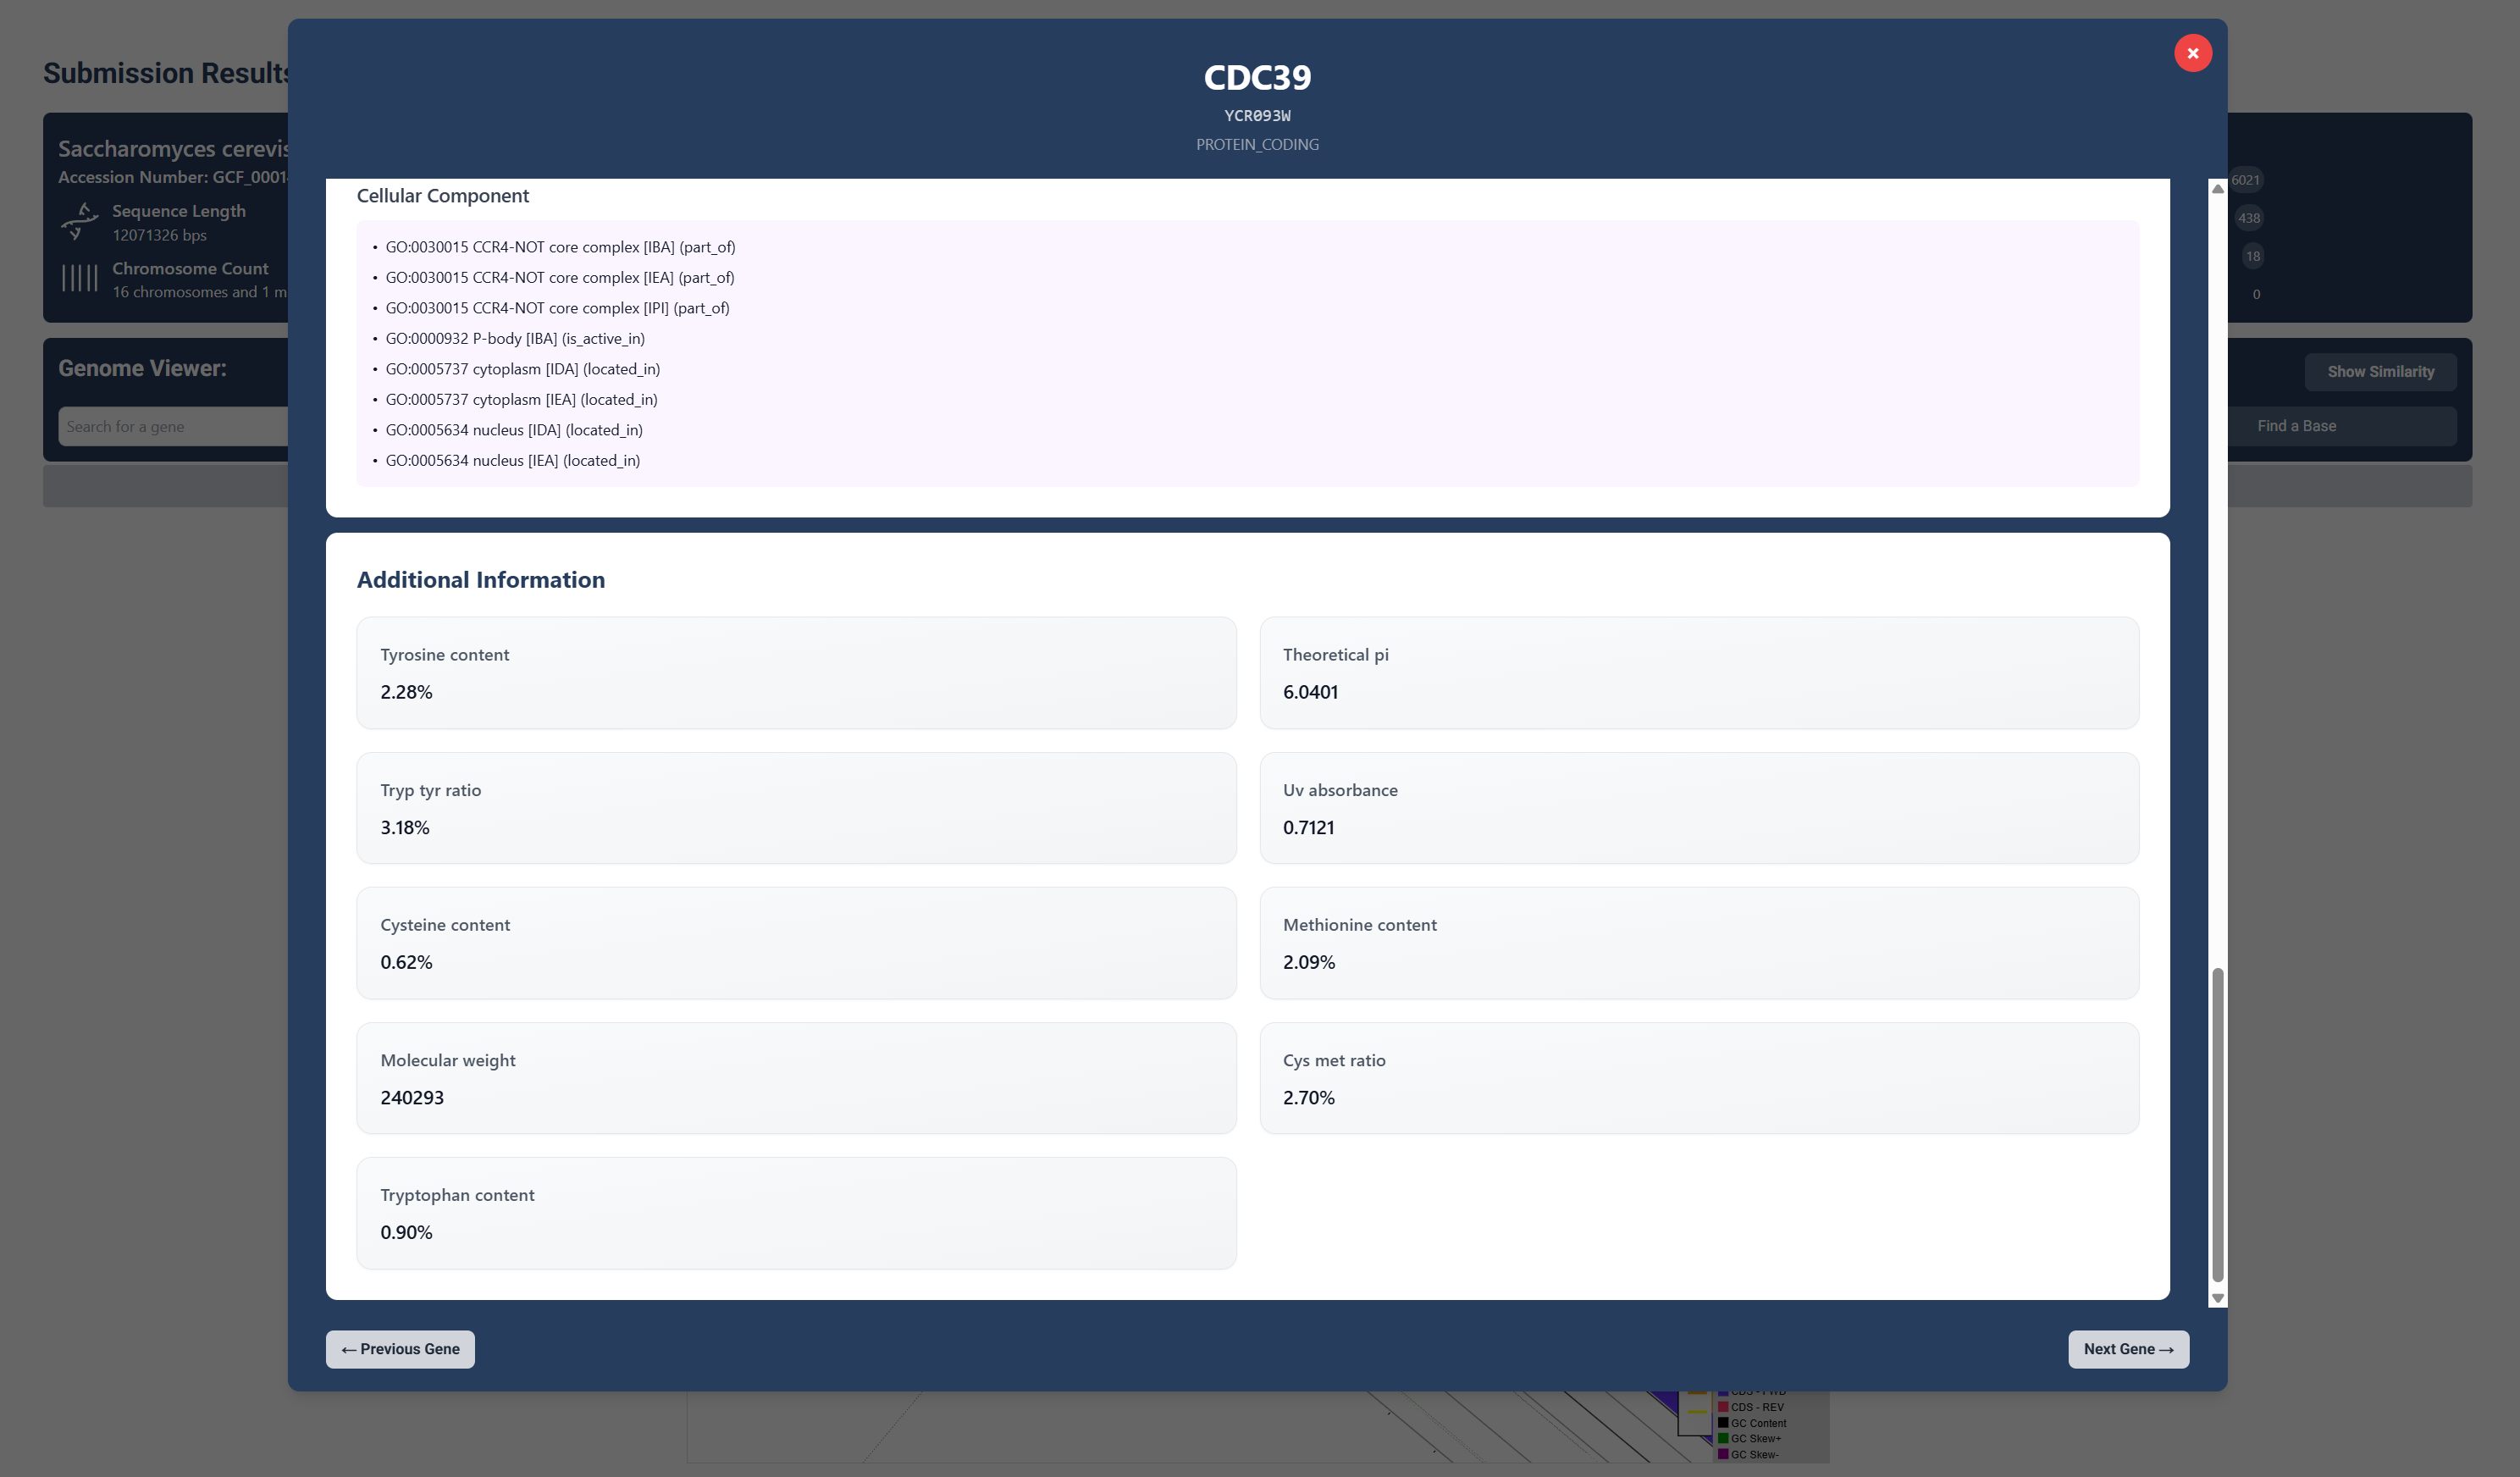
Other additional information includes chromosome number the gene can be found, protein accession numbers and further protein descriptions.
Step 5: Explore gene similarity
Compare genes across your genome for homology and similarity.
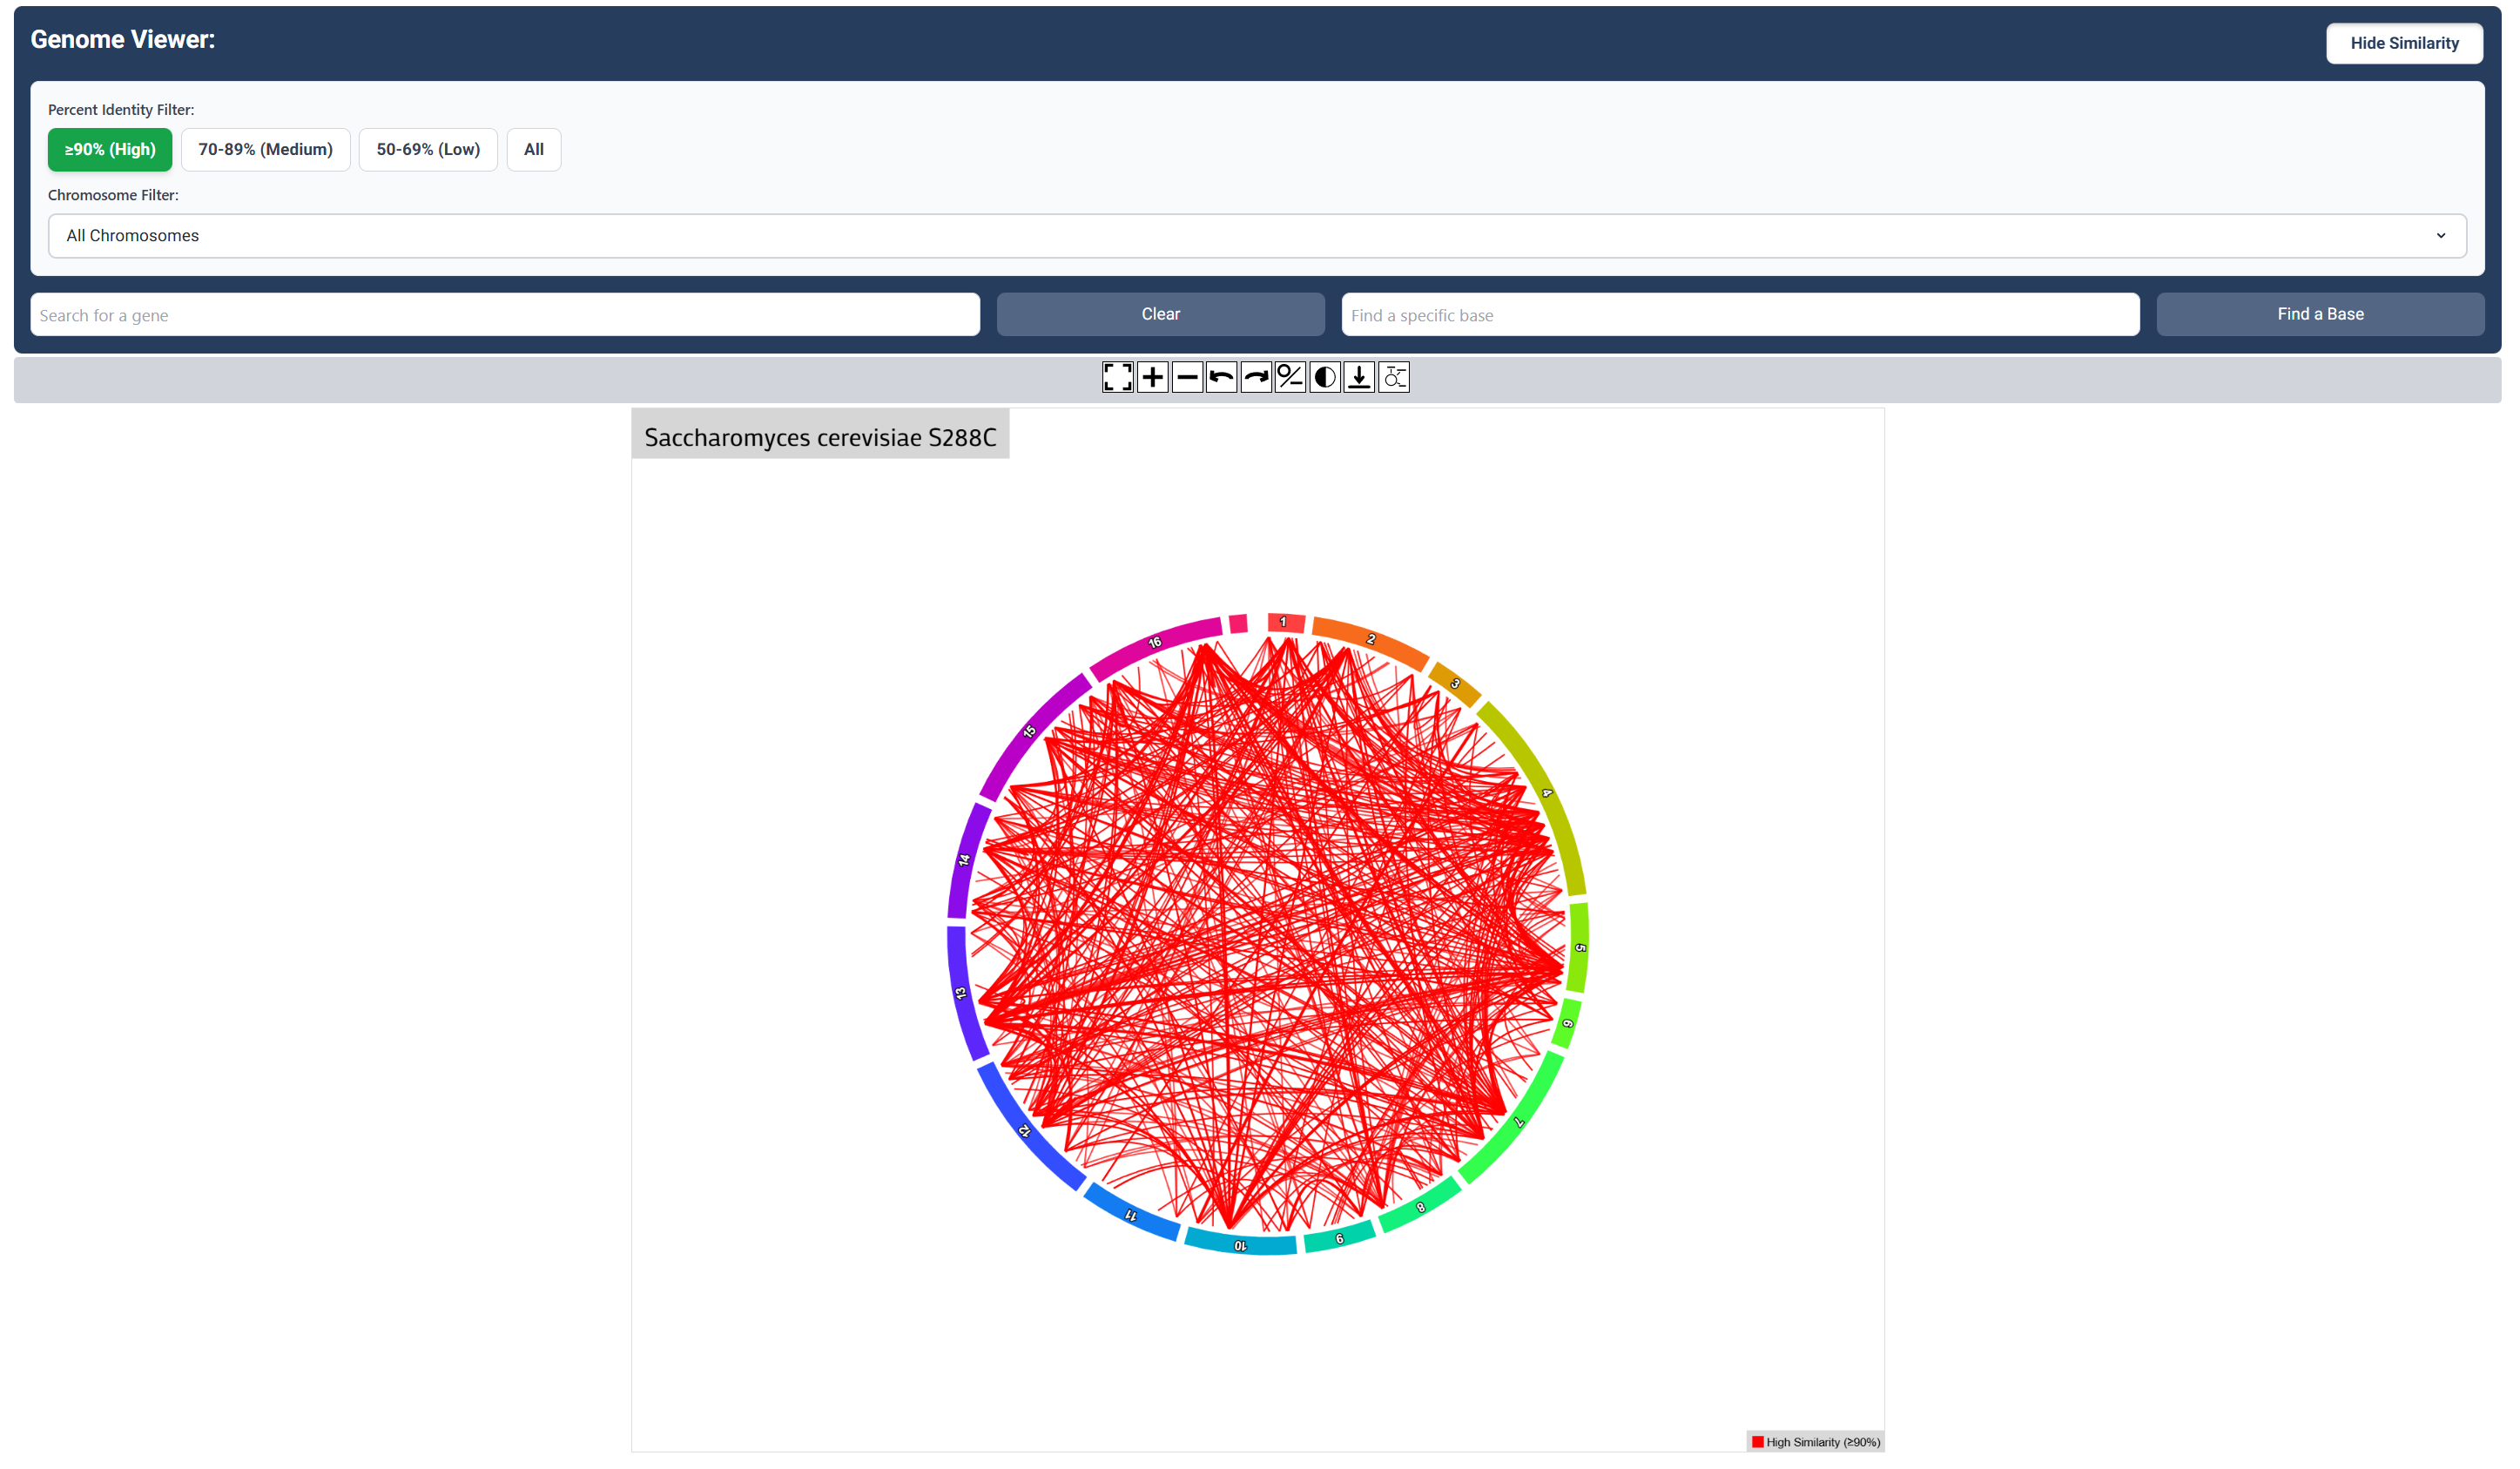
High Sequence Similarity Map
Click the ‘Show Similarity’ button to visualize relationships between genes. This is sequence similarity set to high similiarity (>90%)
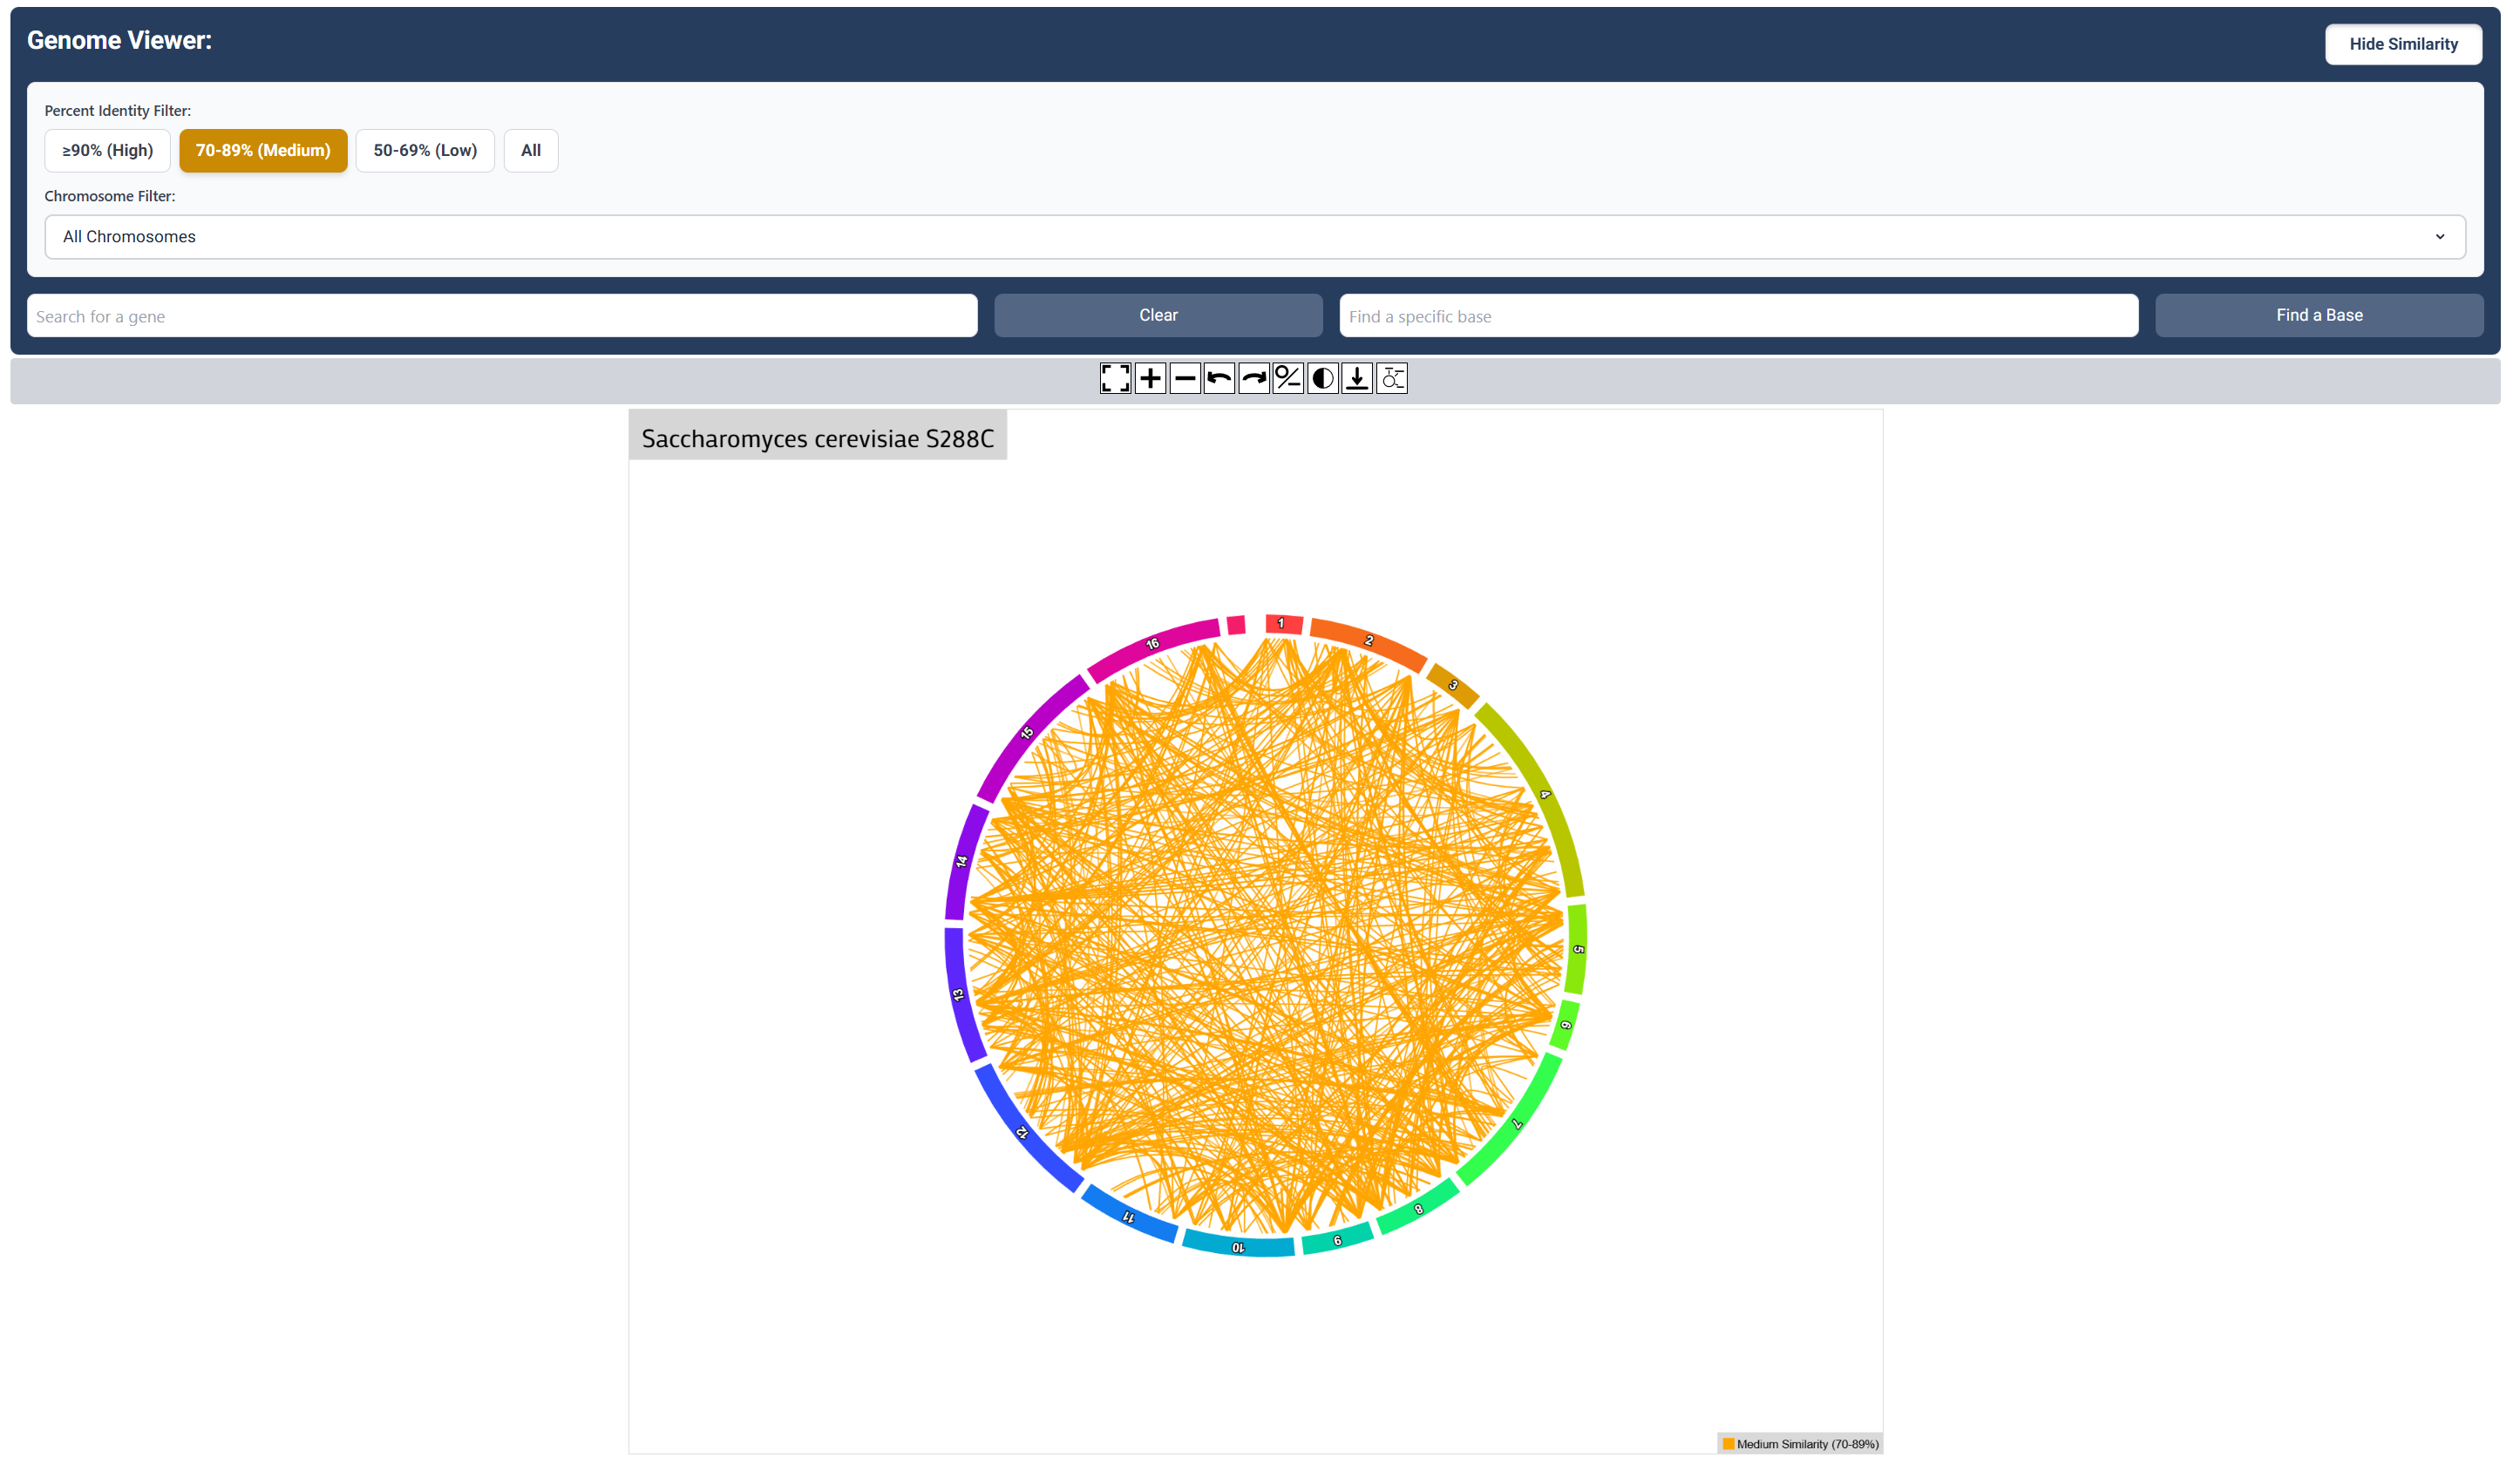
Medium Sequence Similarity Map
Click the ‘Medium’ button to visualize relationships (70-89%) similarity relationship between genes.
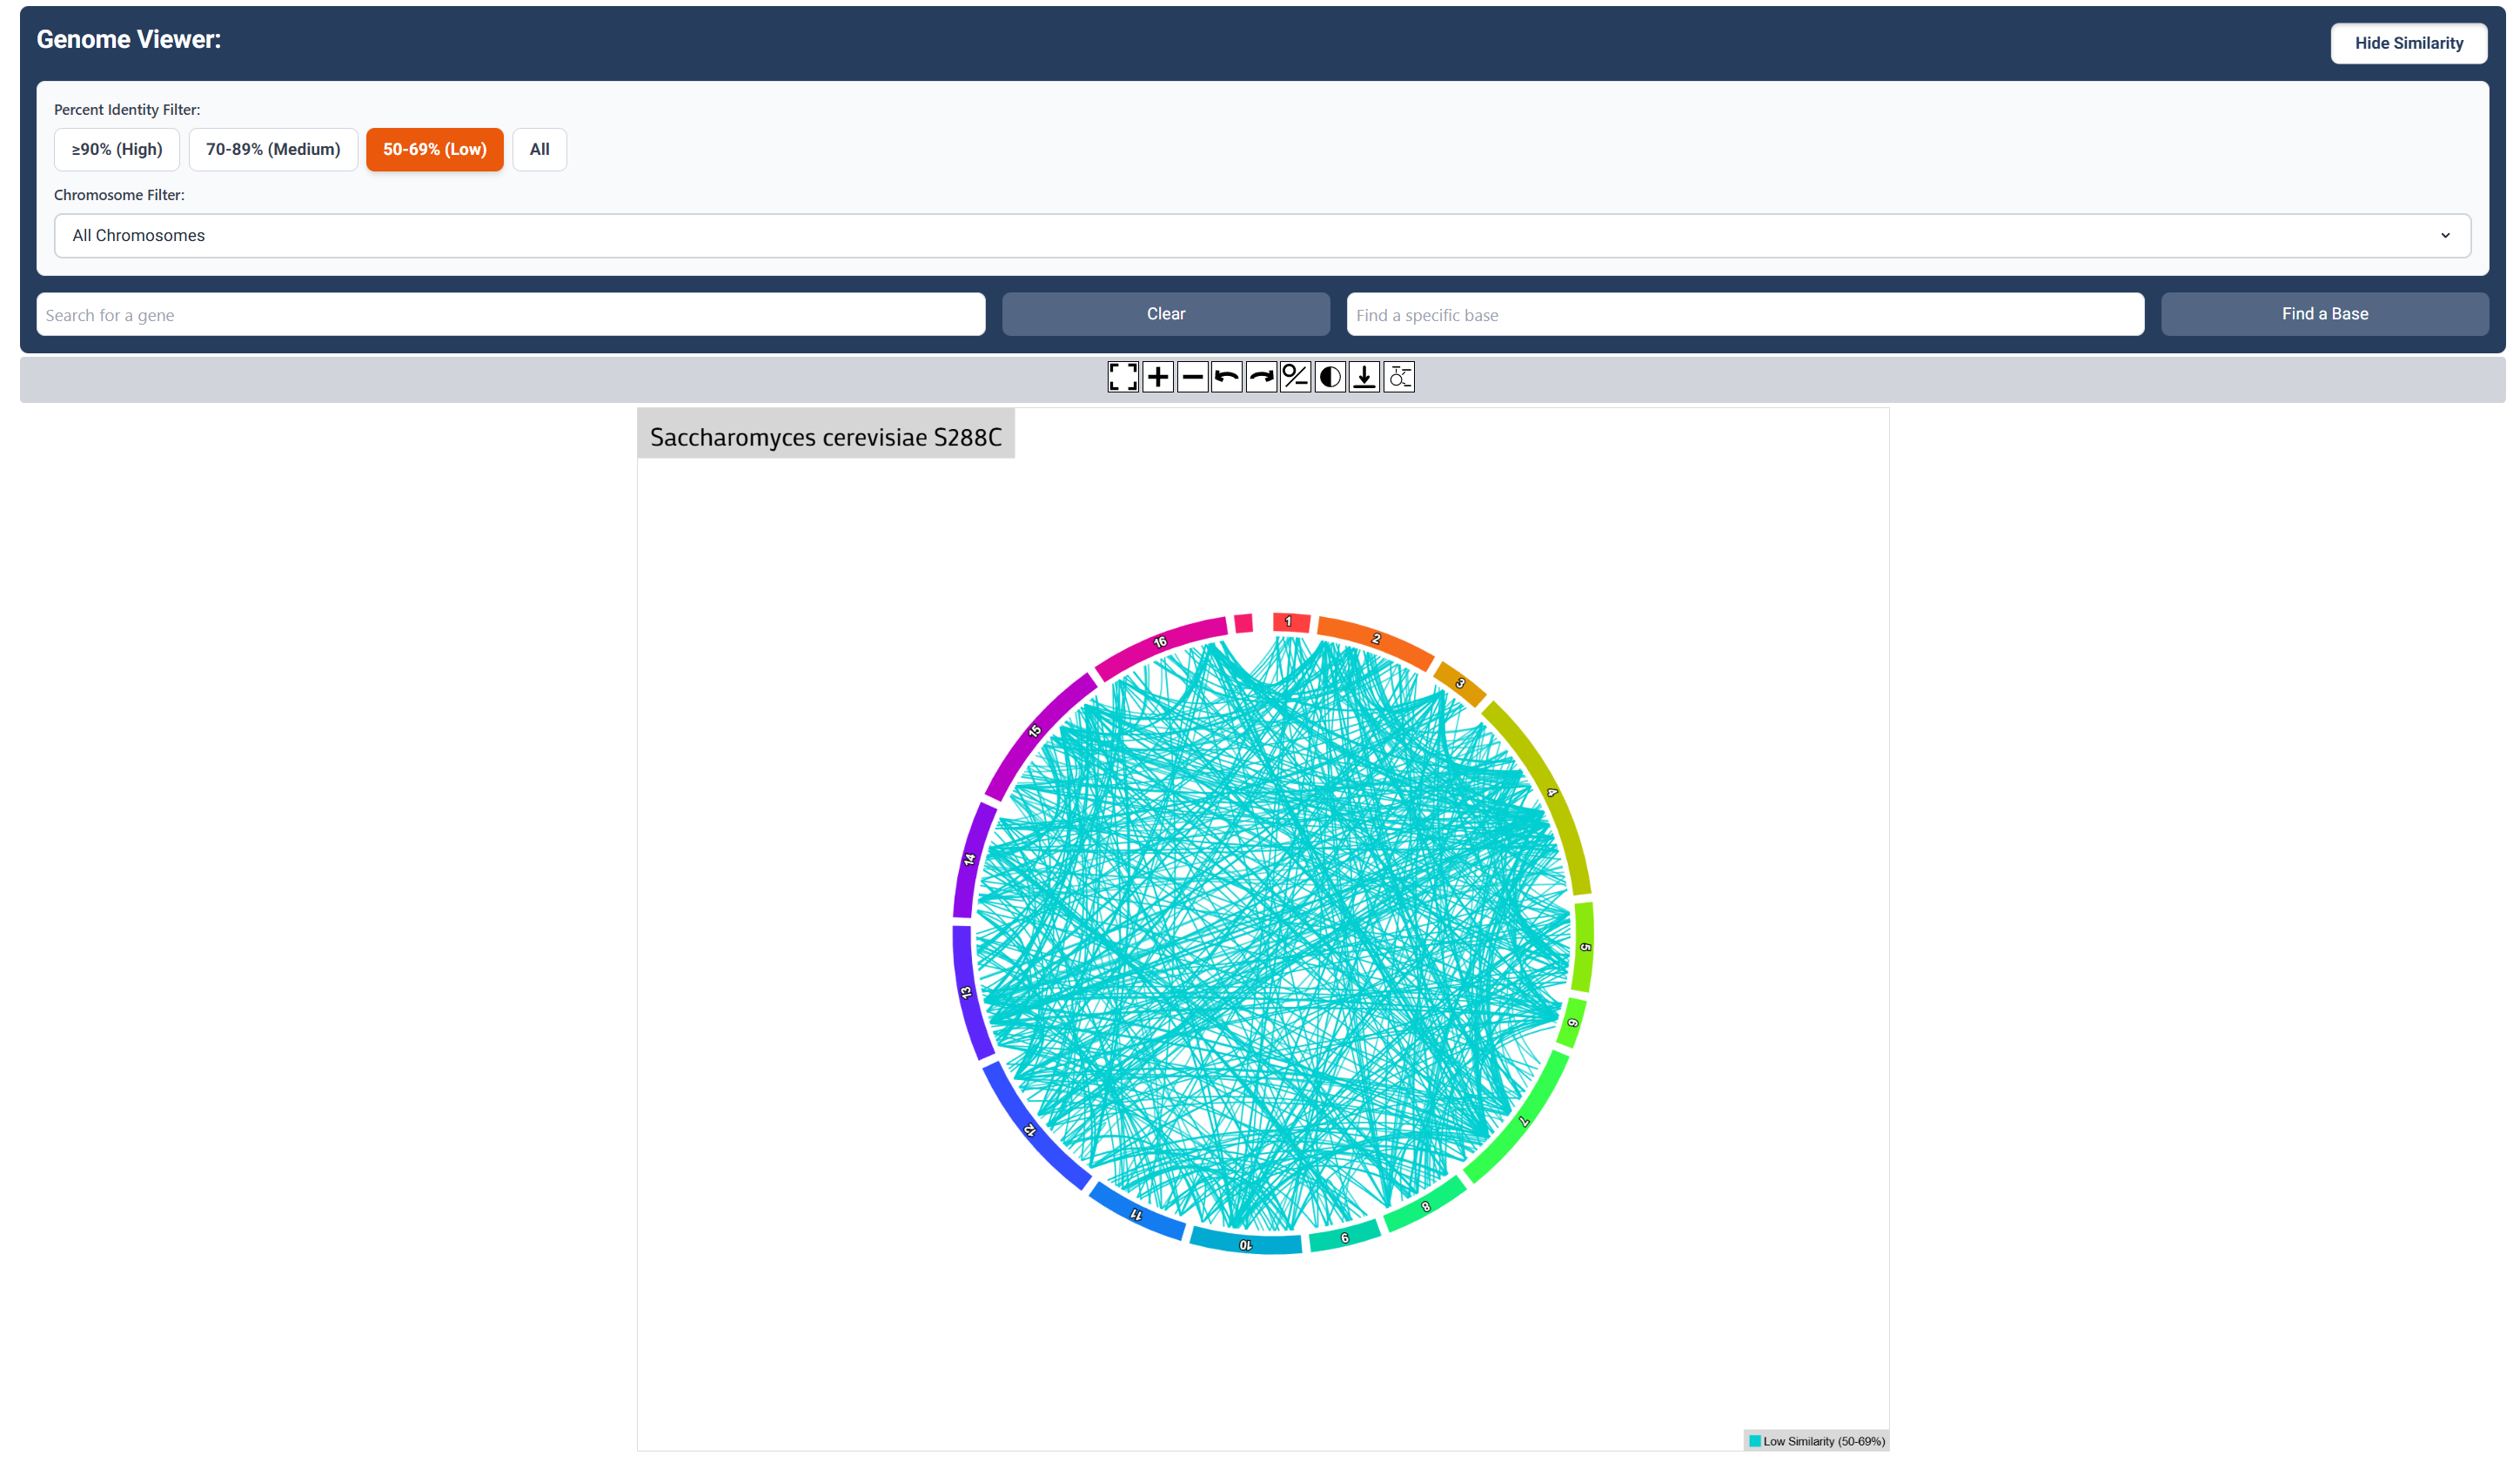
Low Sequence Similarity Map
Click the ‘Low’ button to visualize relationships (50-69%) similarity relationship between genes.
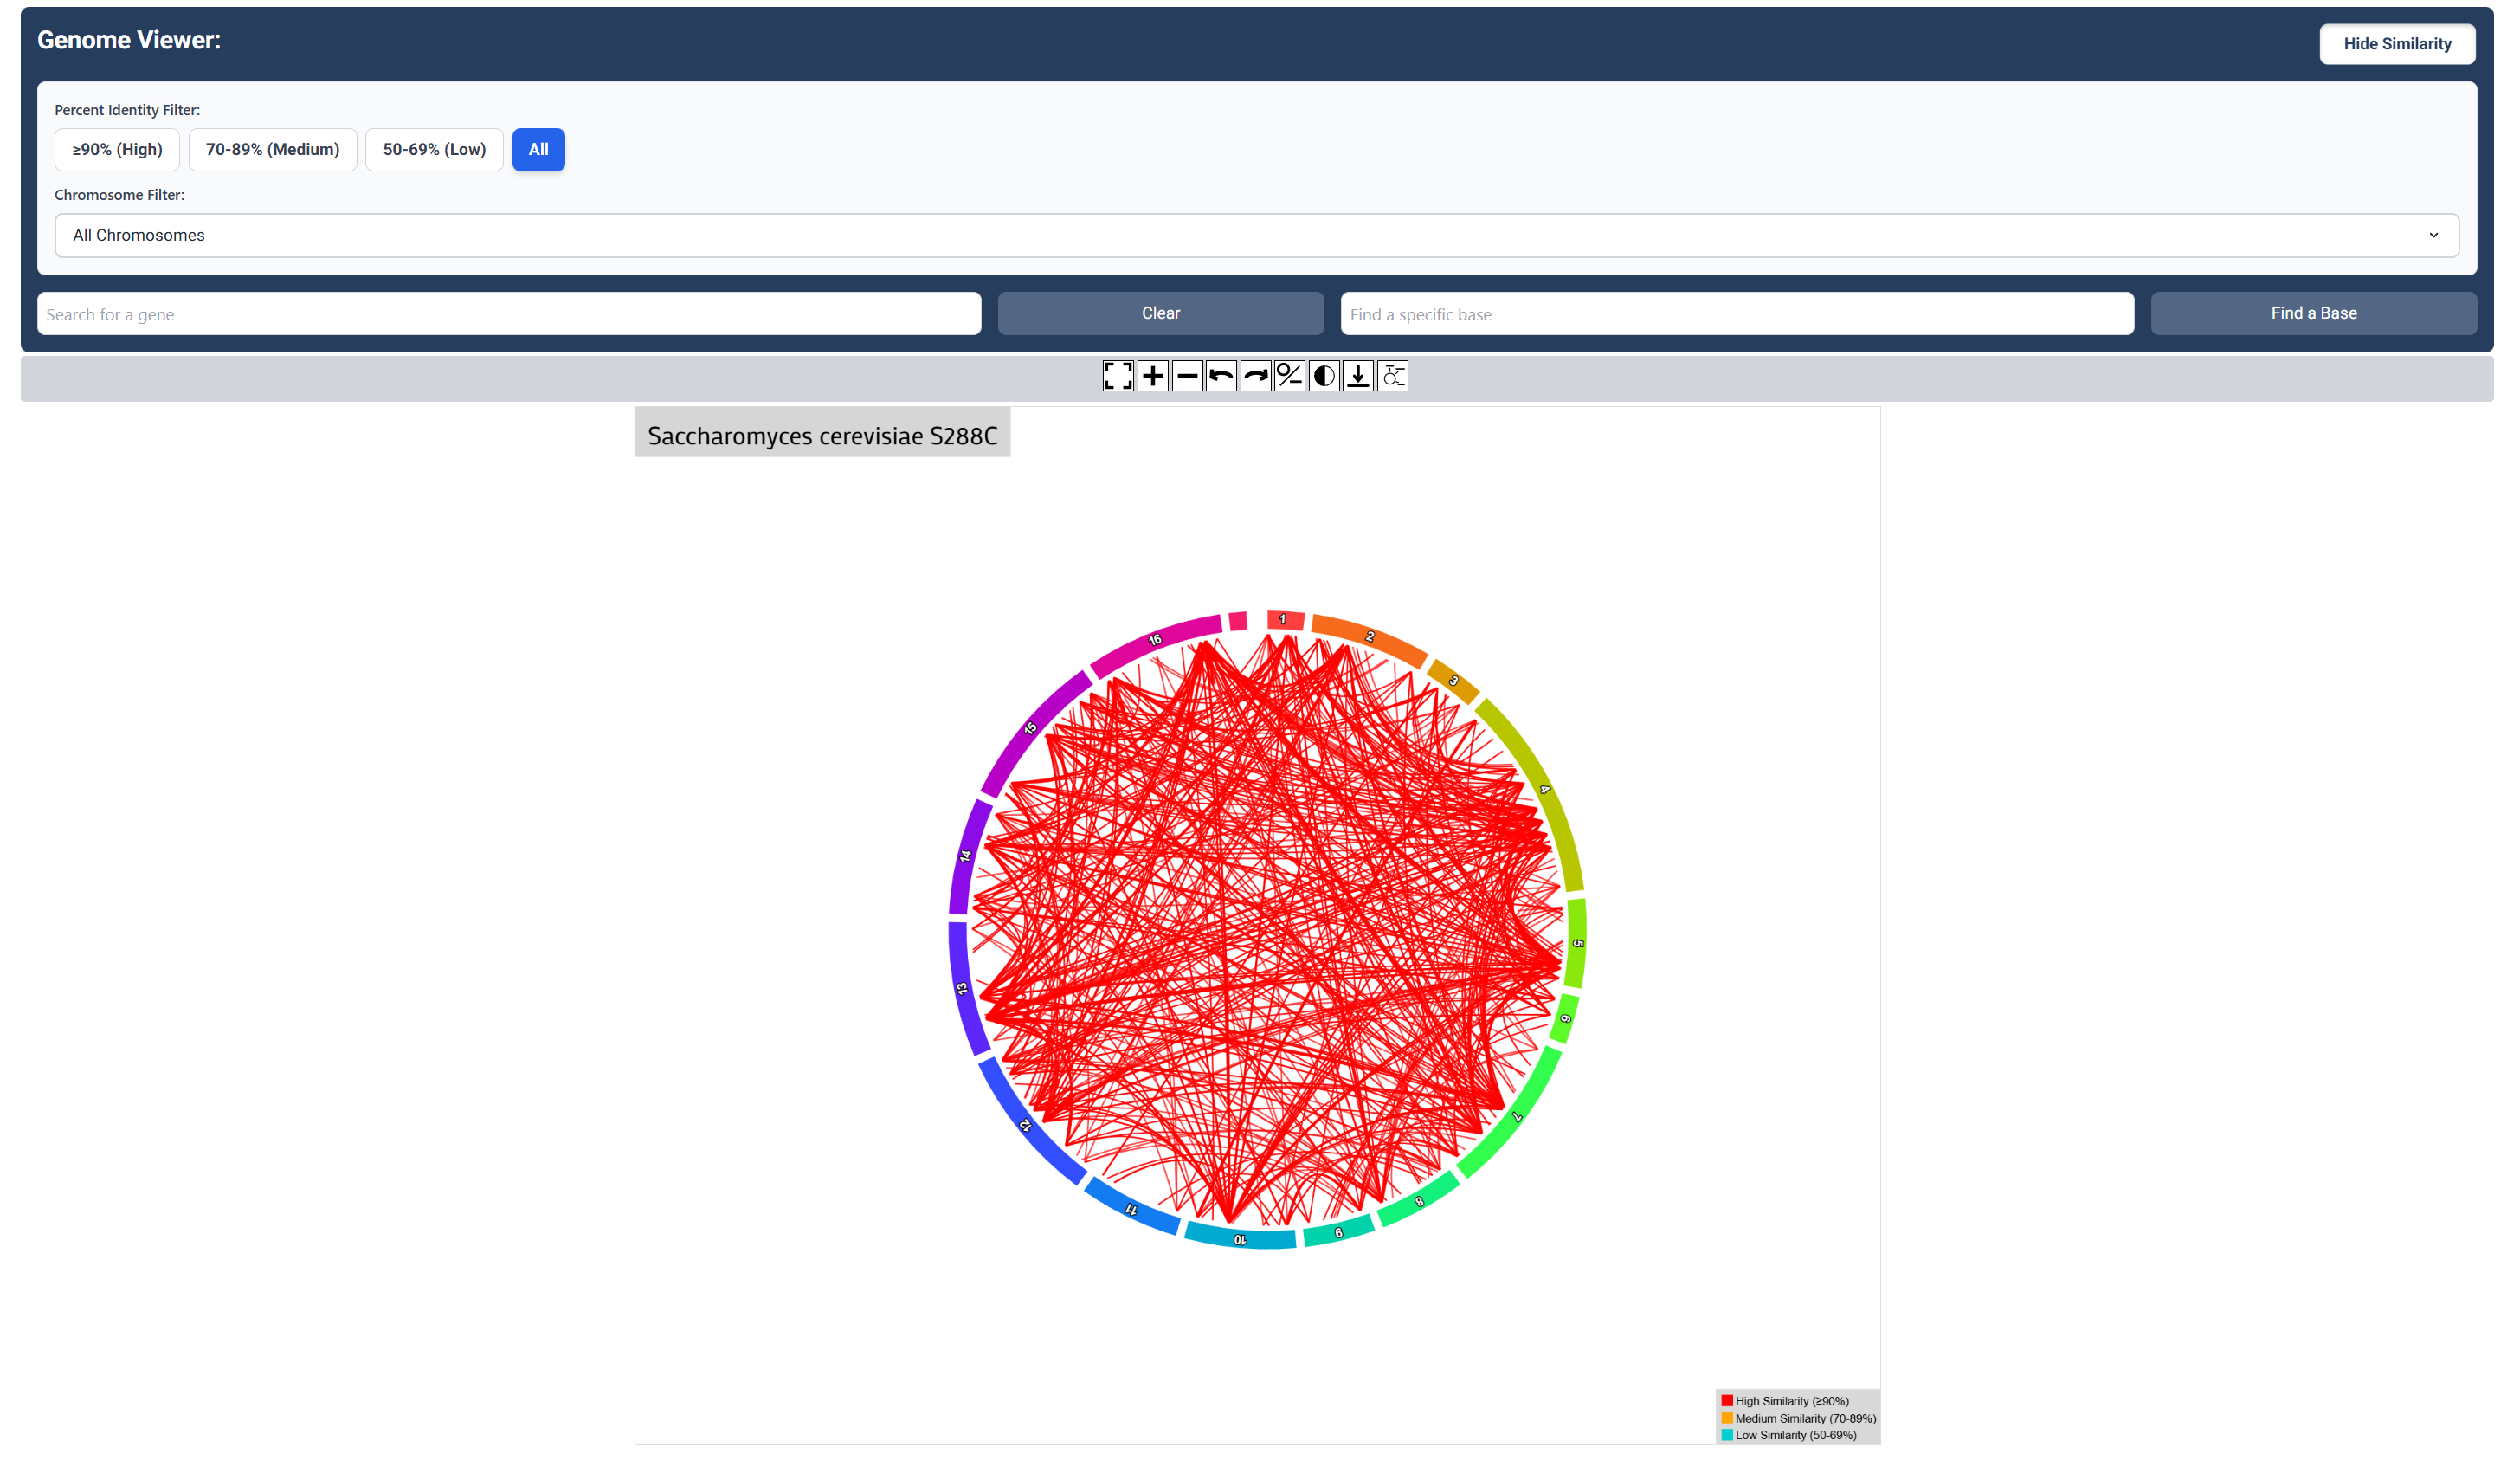
High, Low and Medium (All) Sequence Similarity Map
Click the ‘All’ button to visualize all similarity relationships between genes.
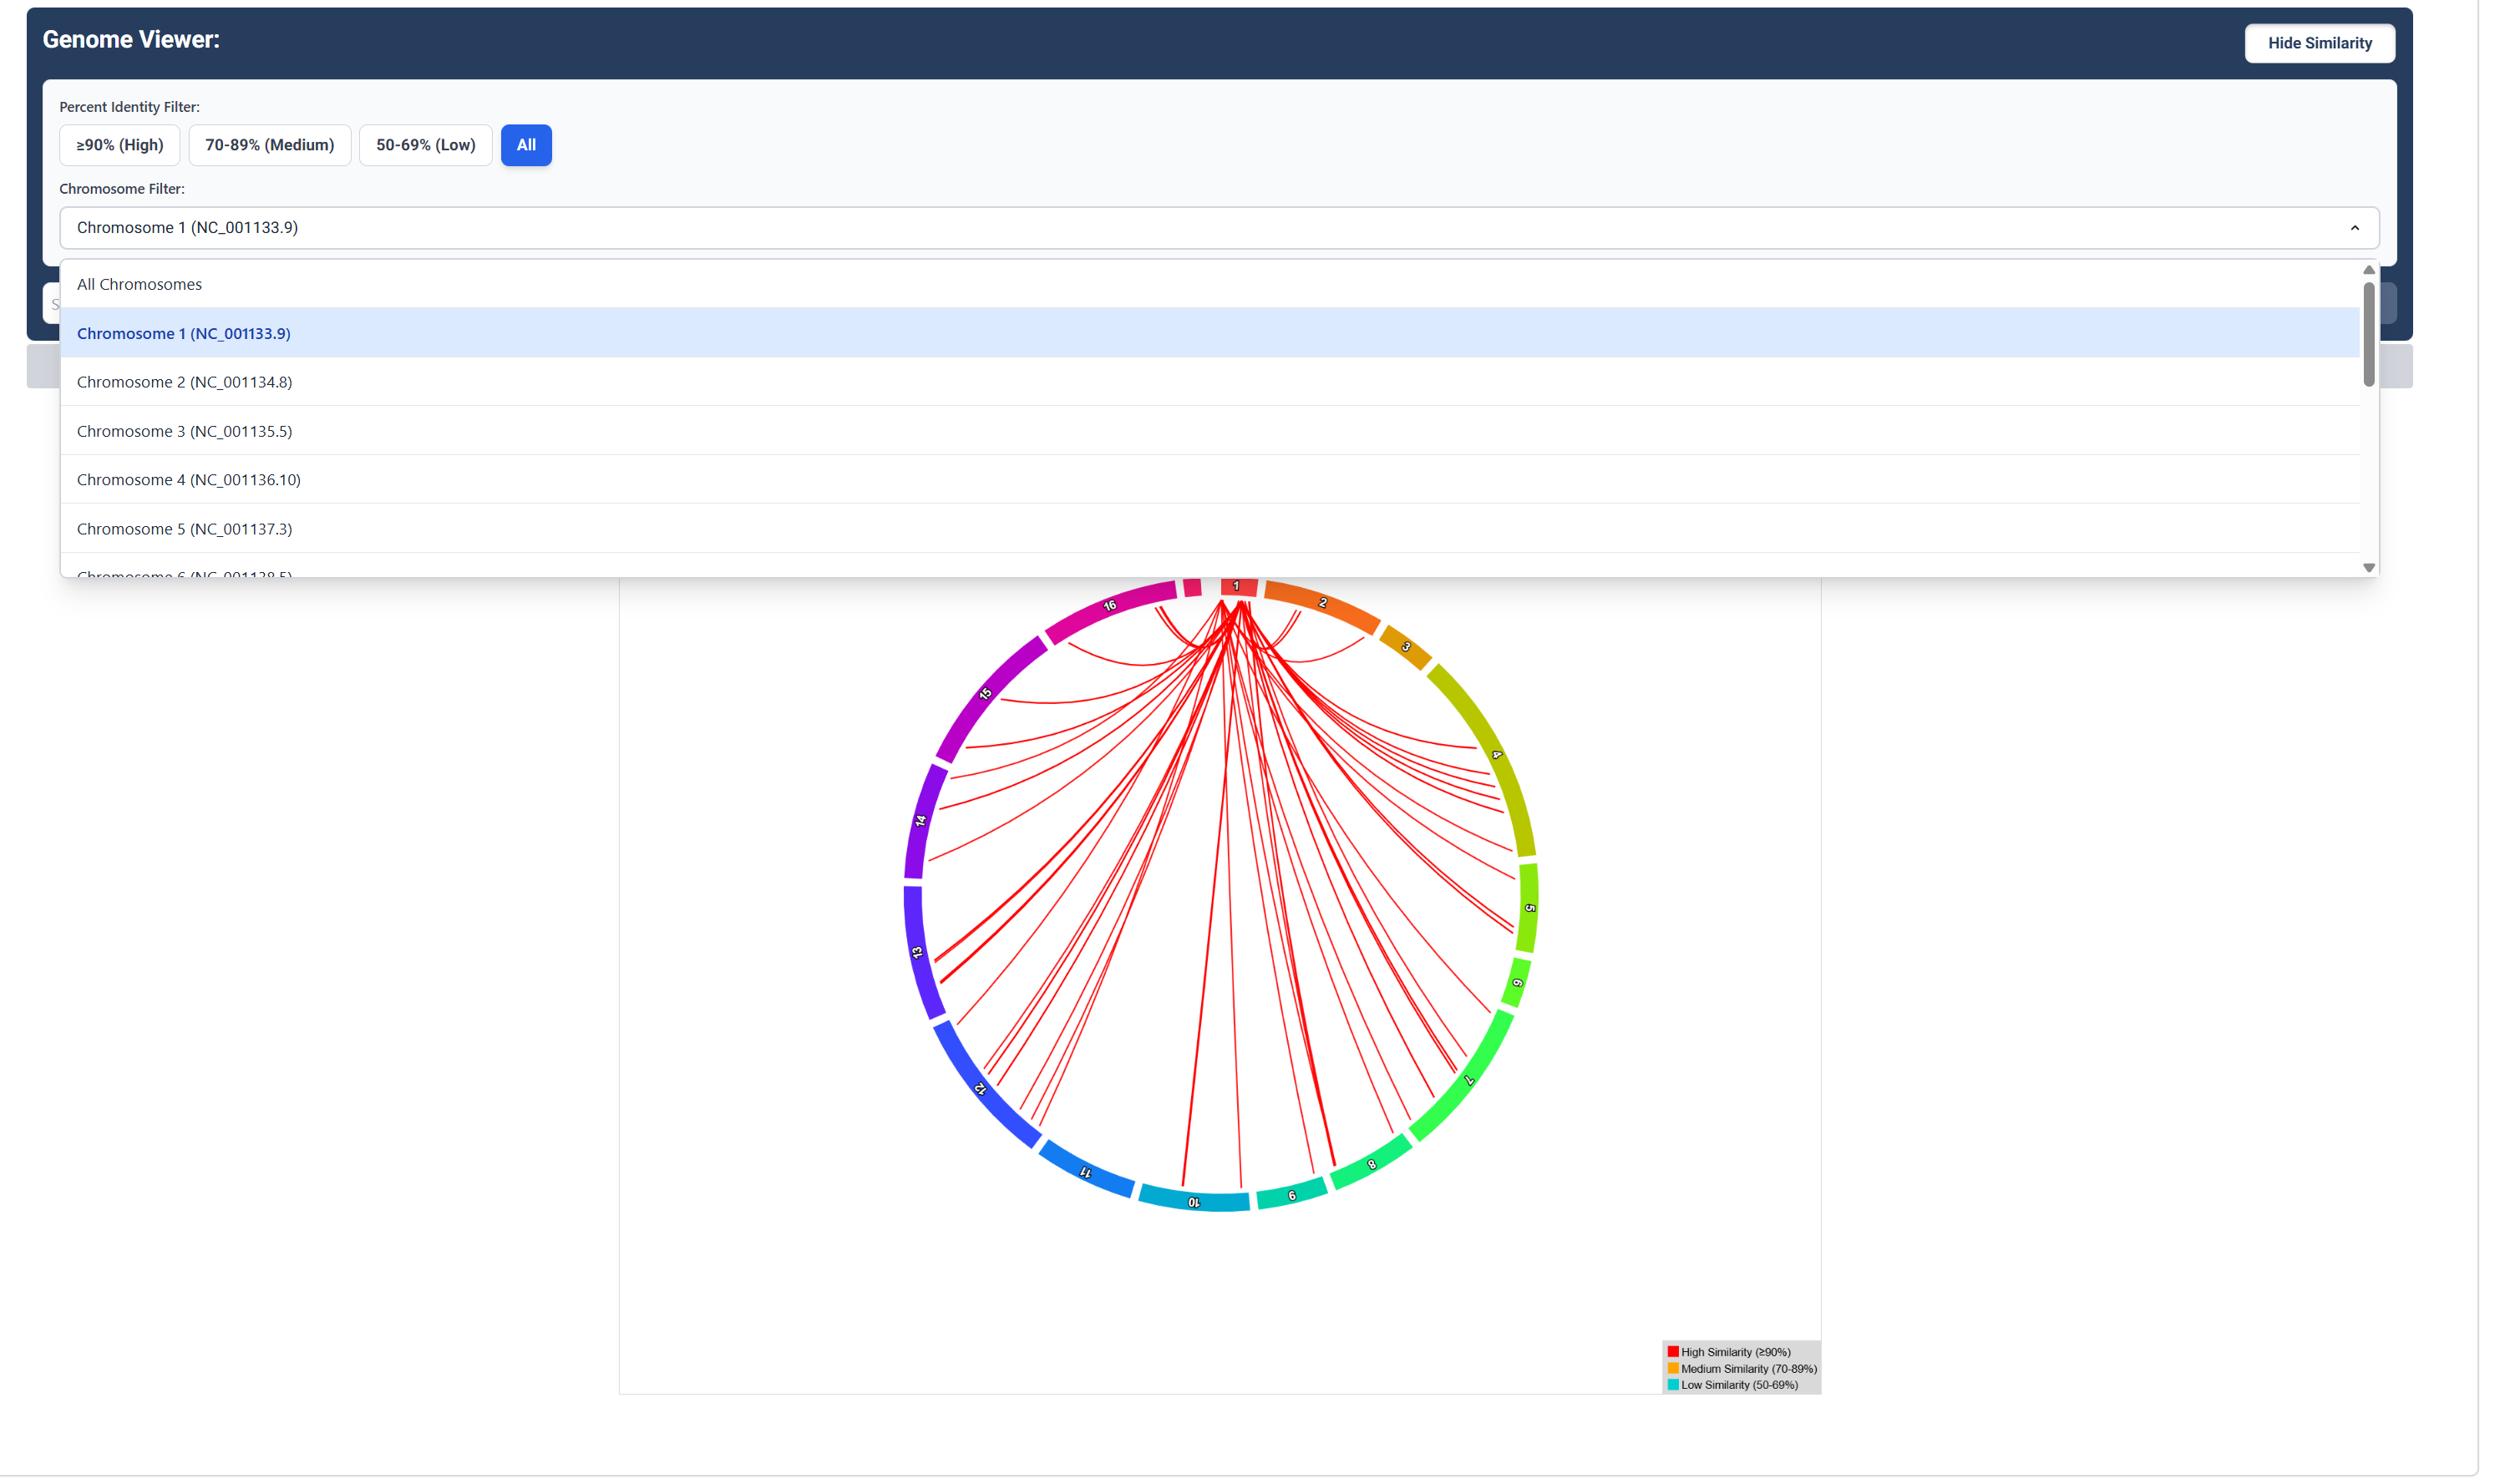
Sequence Similarity Map for a Specific Chromosome
Click the ‘Chromosome Filter’ button to choose a chromosome to visualize similarity relationships between genes for that chromosome.
Sequence Similarity Map Zoomed In
Zoom in to clearly see the colour gradient showing the difference in gene similarities. Note the popup that shows similarity data for the gene to gene connection that you hover over.
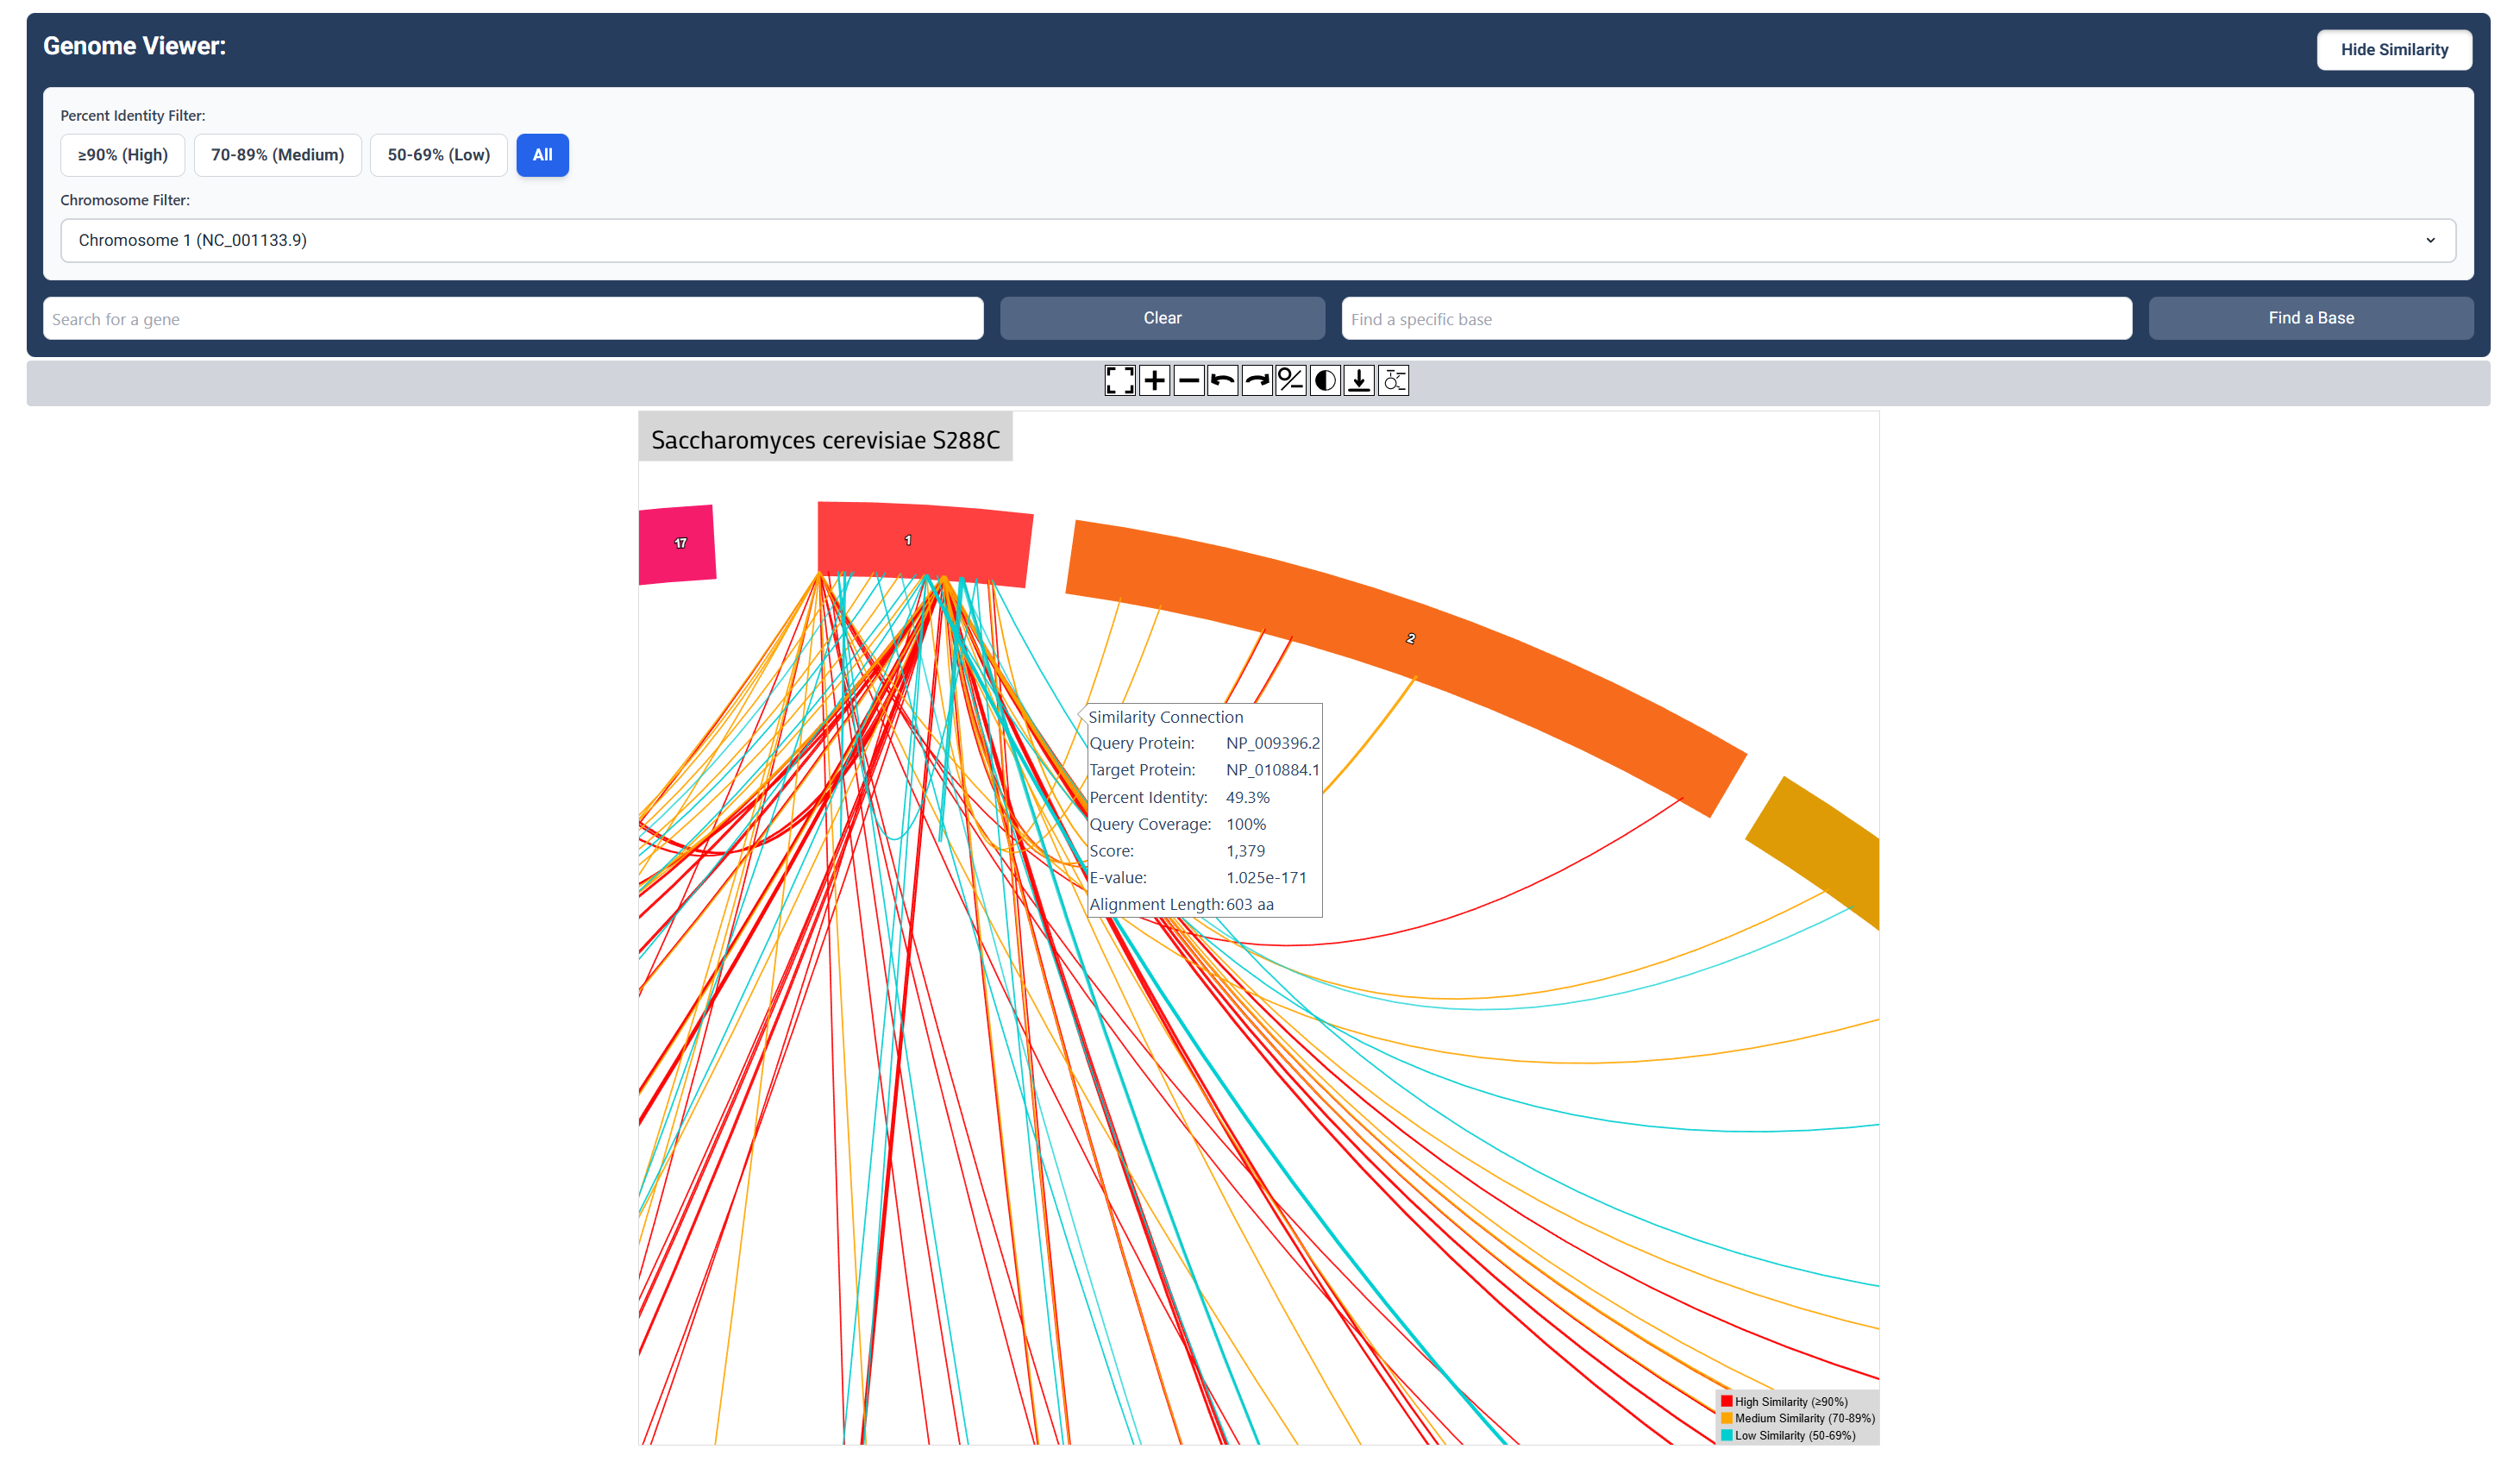
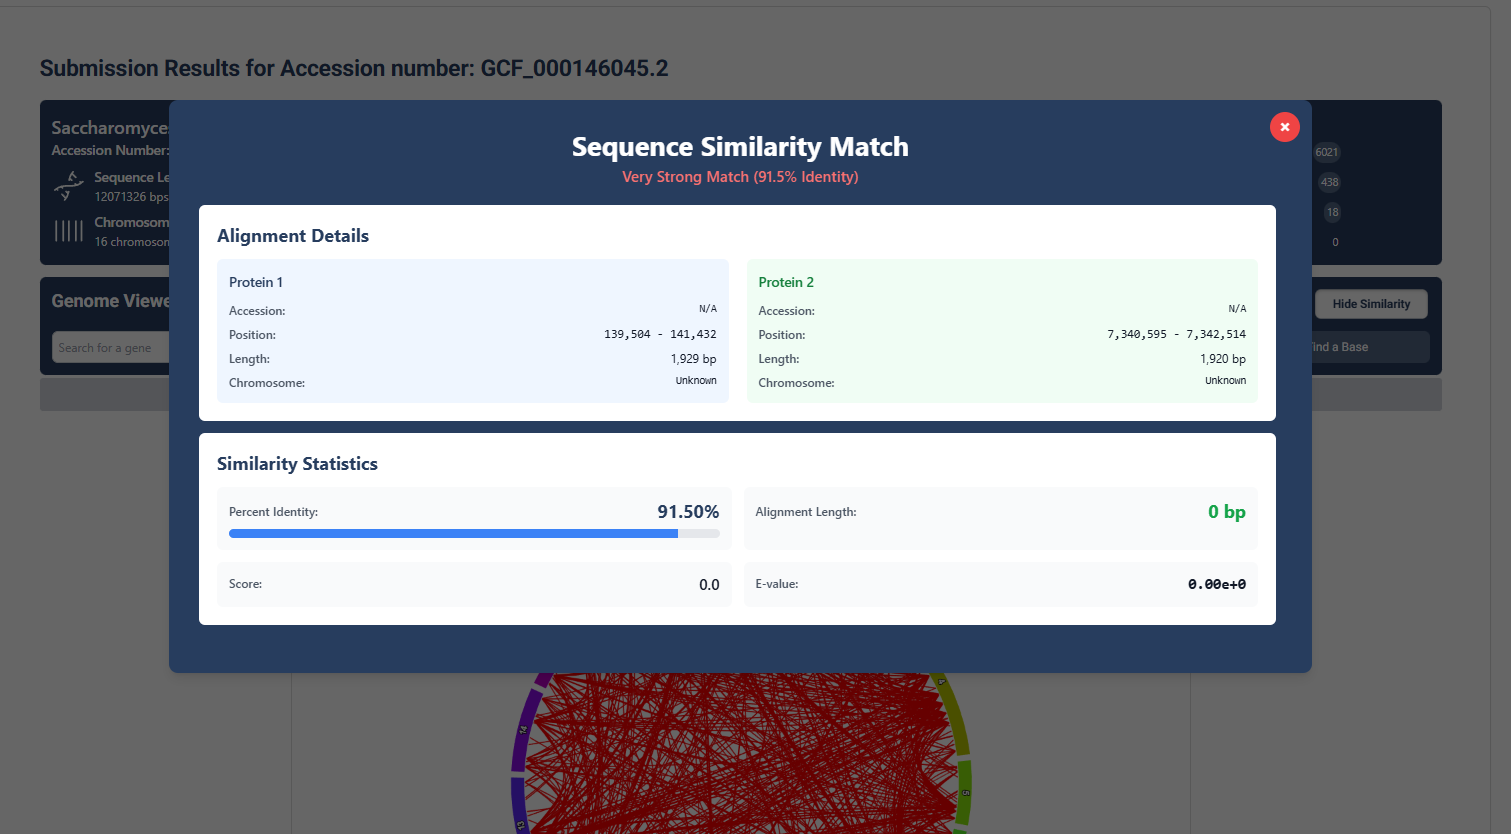
Inspect Specific Gene Similarity Data
Export similarity results between specific genes by clicking on connections found on the map.